3.1 What is an Earthquake?
Steven Earle and Laura J. Brown
An earthquake is what happens when two blocks of the earth suddenly slip past one another. The surface where they slip is called the fault or fault plane. The location below the earth’s surface where the earthquake starts is called the hypocenter, and the location directly above it on the surface of the earth is called the epicenter.
A body of rock that is under stress becomes deformed. When the rock can no longer withstand the deformation, it breaks, and the two sides slide past each other. Most earthquakes take place near plate boundaries—but not necessarily right on a boundary—and not necessarily even on a pre-existing fault.
Loma Prieta Earthquake 1989
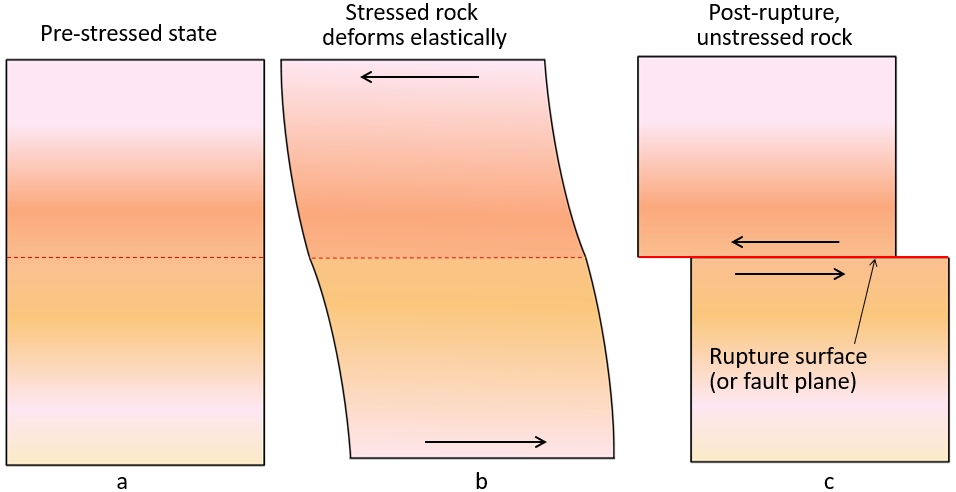
The engineering principle of elastic deformation, which can be used to understand earthquakes, is illustrated in Figure 3.1. The stress applied to a rock—typically because of ongoing plate movement—results in strain or deformation of the rock (Figure 3.1b). Because most rock is strong (unlike loose sand, for example), it can withstand significant deformation without breaking. But every rock has a deformation limit and will rupture (break) once that limit is reached. At that point, in the case of rocks within the crust, the rock breaks, and there is displacement along the rupture surface (Figure 3.1.). The earthquake’s magnitude depends on the extent of the area that breaks (the area of the rupture surface) and the average amount of displacement (sliding).
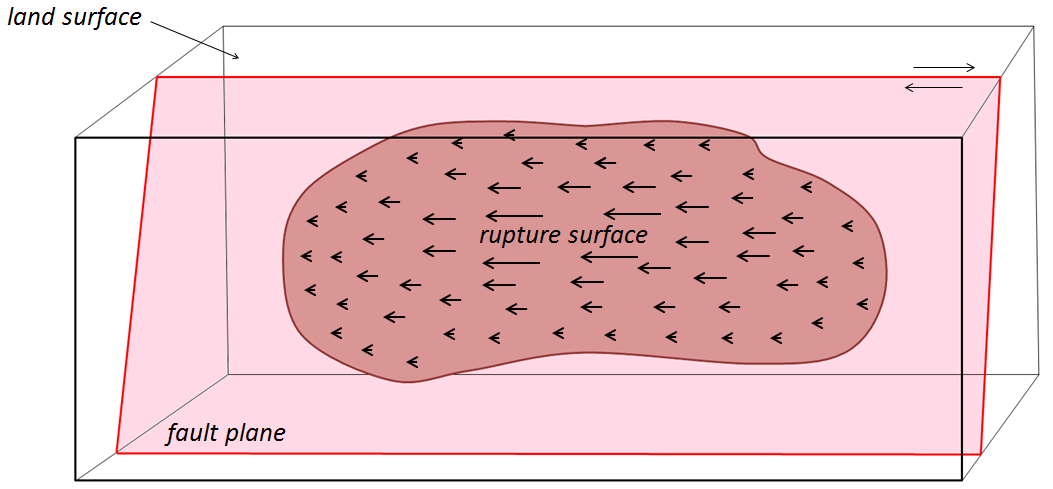
The concept of a rupture surface, which is critical to understanding earthquakes, is illustrated in Figure 3.2. An earthquake does not happen at a point. It happens over an area within a plane, although not necessarily a flat plane. Within the area of the rupture surface, the amount of displacement is variable (Figure 3.2). By definition, it decreases to zero at the edges of the rupture surface because the rock beyond that point isn’t displaced at all. The extent of a rupture surface and the amount of displacement will depend on several factors, including the type and strength of the rock and the degree to which it was stressed beforehand.
Earthquake rupture doesn’t happen all at once; it starts at a single point and spreads rapidly from there. Depending on the extent of the rupture surface, the propagation of failures out from the point of initiation is typically completed within seconds to several tens of seconds (Figure 3.4). The initiation point isn’t necessarily in the centre of the rupture surface; it may be close to one end, near the top, or near the bottom.
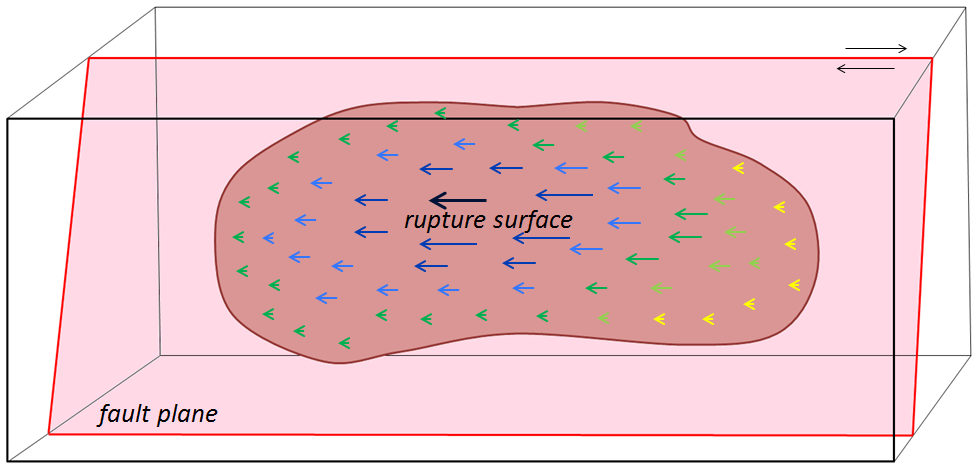
Figure 3.4 shows the distribution of immediate aftershocks associated with the 1989 Loma Prieta earthquake. Panel (b) is a section along the San Andreas Fault; this view is equivalent to what is shown in Figures 3.2 and 3.3. The area of red dots is the rupture surface; each red dot is a specific aftershock recorded on a seismometer. The hexagon labelled “main earthquake” in each panel represents the first or main shock. When that happened, the rock at that location broke and was displaced. That released the stress on that particular part of the fault, but it resulted in an increase of the stress on other nearby parts of the fault and contributed to a cascade of smaller ruptures (aftershocks), in this case, over an area of about 60 kilometres long and 15 kilometres wide.
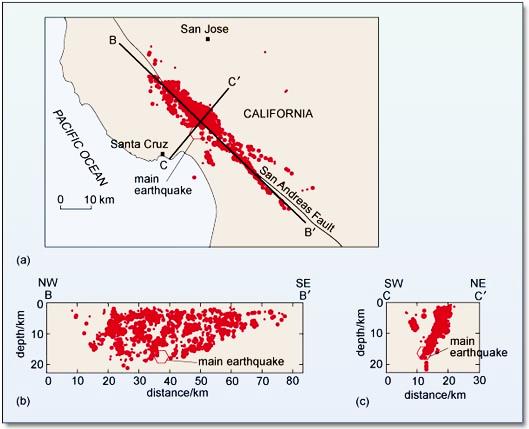
So, what exactly is an aftershock then? An aftershock is an earthquake like any other, but it can be shown to have been triggered by stress transfer from a preceding earthquake. Within a few tens of seconds of the main Loma Prieta earthquake, there were hundreds of smaller aftershocks; their distribution defines the area of the rupture surface.
Aftershocks can be of any magnitude. Most are smaller than the earthquake that triggered them, but they can be bigger. The aftershocks shown in Figure 3.4 all happened within seconds or minutes of the main shock, but aftershocks can be delayed for hours, days, weeks, or even years. As already noted, aftershocks are related to stress transfer. For example, the main shock of the Loma Prieta earthquake triggered aftershocks in the immediate area, which triggered more in the surrounding area, eventually extending for 30 kilometres along the fault in each direction and for 15 kilometres toward the surface. But the earthquake as a whole also changed the stress on adjacent parts of the San Andreas Fault. This effect, which has been modelled for numerous earthquakes and active faults around the world, is depicted in Figure 3.5. Stress was reduced in the area of the rupture (blue) but increased at either end of the surface (red and yellow).
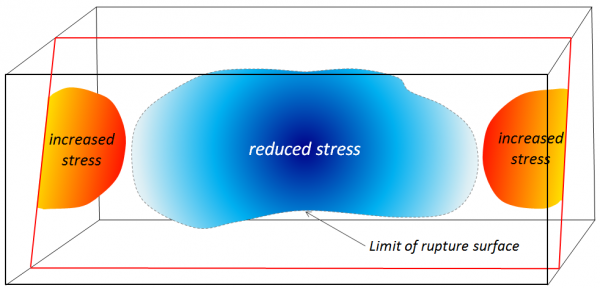
Stress transfer isn’t necessarily restricted to the fault of an earthquake. It will affect the rocks in general around the site of the earthquake and may lead to increased stress on other faults in the region. The effects of stress transfer don’t necessarily show up right away. Segments of faults are typically in some state of stress, and the transfer of stress from another area is only rarely enough to push a fault segment beyond its limits to the point of rupture. The stress that is added by stress transfer accumulates along with the ongoing buildup of stress from plate motion and eventually leads to another earthquake.
Media Attributions
- Figure 3.1. USGS Public Domain
- Figure 3.2, 3.3, 3.6: © Steven Earle. CC BY.
- Figure 3.4: © Open University. CC BY-SA.
- Figure 3.5: © Steven Earle. CC BY. Based on data from the 2010 Laguna Salada earthquake by Stein and Toda.
