
23 Burndown Charts
CONTENT

- What is a Burndown Chart?
- Using a Burndown Chart
- The Big Board
- When is The Requirement/User Story Finished?
- Activity: Working with the Burndown Chart
SLIDE DECKS
Some of the material presented in this chapter will be discussed in class. It is your responsibility to ensure you cover all the concepts presented both in class and in this textbook.
Having a timeline is great because it allows us to set out a production plan that should result in a completed functional product by the end of the first milestone. It allows us to designate which developer will work on which element of the project, and when.
However, you probably already know that even the best-laid plans go awry. Things will pop up that will cause us to fall behind, or to require a partial or complete redrafting of the plan. That’s life. In those situations, it’s good to keep a level head and to do our best to take the changes in stride.
Of course, it’s also important to monitor the work to stay on track. One way that we do this is using a Burndown Chart.
What Is A Burndown Chart?
A burndown chart provides a graphical way of monitoring the work that has been completed by a team (and therefore the amount of work that remains to be done).
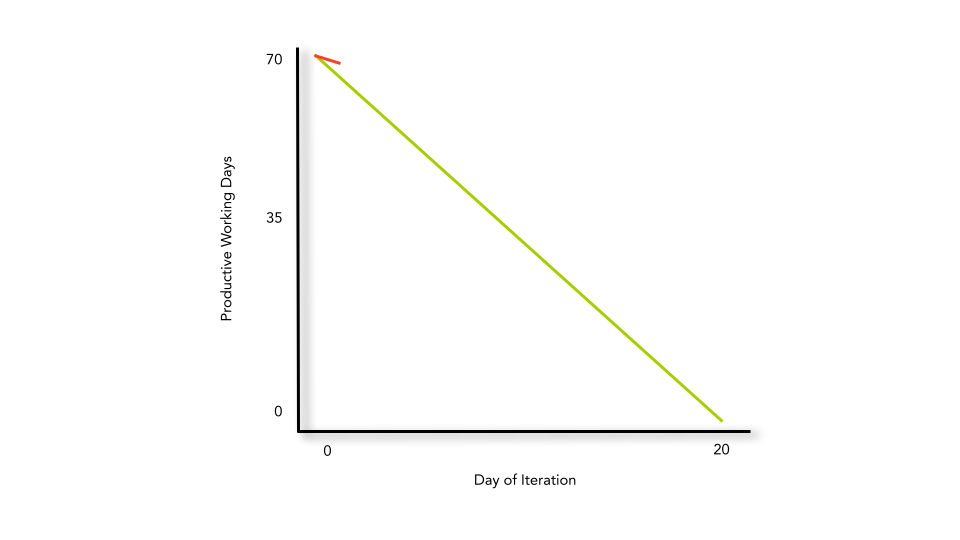
While there are variations on a burndown chart, typically the x-axis represents the number of working days available in an iteration (or some other block of time, such as a week).
The y-axis represents the amount of work that needs to be completed during the iteration. This should range from 0 to the maximum amount of work that can be done by a team given the maximum number of working days represented on the x-axis. For a team of 5 with a velocity of 70% and an iteration period of 20 days, the y-axis would have a maximum value of 70 productive working days.
It’s important to note that some burndown charts will use hours or some other time unit. While the unit may differ, the point of the chart and how it is read remains the same.
Using A Burndown Chart
At the beginning of each iteration, the team lead will draw two points. The first will be placed where the “Day of Iteration” is zero and the “Productive Working Days” is at its maximum. This indicates the maximum amount of work that needs to be completed when the iteration begins. The second point will be
placed on the last day of the iteration where the “Productive Working Days” is at 0. This assumes that all the work has been completed by the end of the last day of the iteration.
Once these points are placed, they are connected with a straight line representing the ideal burndown. This line tells you at any point in the iteration how much work should be completed given the velocity of the team. The negative slope of this line divided by the number of team members is the expected velocity.
At the end of each day, the team lead will determine how much work has been completed. For example, assuming a team of 5 people with a velocity of 70% and an iteration period of 20 days:
- If at the end of day 1, the team completed a set of requirements (or tasks) that required 2 productive working days of effort (leaving 70-2=68 productive working days of effort to complete), they would draw a point at the coordinate (1, 68) and connect this with a line to the point (0, 70). This line represents the true production level of the team. The negative slope of this line divided by the number of team members is the true daily velocity of the team over day 1. In this case, we’d have a velocity of 40% (which is well below our expected value of 70%). In truth, we would have expected a team to complete 3.5 productive working days of effort by the end of day one.
- At the end of each subsequent day, the team leader would determine how much work had been completed, and plot this on the chart. Each end-of-day point would be connected with a straight line to the end-of-day point from the day before it. The negative slope of the line connecting the two points divided by the number of team members represents that day’s true daily velocity.
- To calculate the average velocity since the beginning of the iteration, the negative slope between the start of the burndown chart and the current end-of-day point is calculated, then divided by the number of team members.
- If the true daily velocity or the average velocity is not what is expected, the team and the team leader should discuss this to determine what issues might exist, and how best to address them.
- This process is repeated until the end of the iteration when a new burndown chart is created.
In addition to the expected production line, and the actual production line, some burndown charts also include:
- The count of the number of tasks that have been completed every single day, and the total number of tasks that have yet to be completed. This information is often presented using a second y-axis.
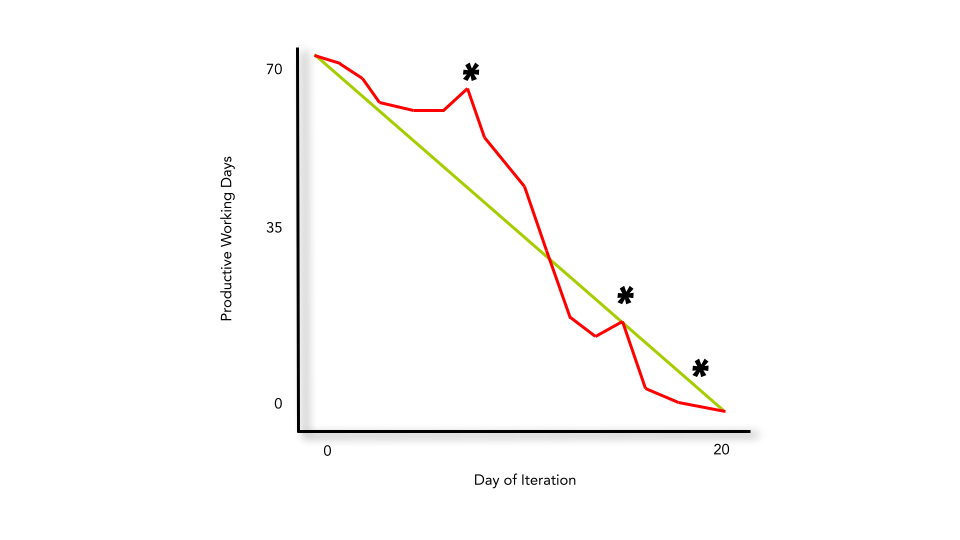
Consider the completed Burndown chart.
- When was the team velocity less than 70%?
- When was the team velocity greater than 70%?
- Did the team get all their work completed?
- What may have happened during the parts of the iteration marked with an asterisk (*)?
The Big Board
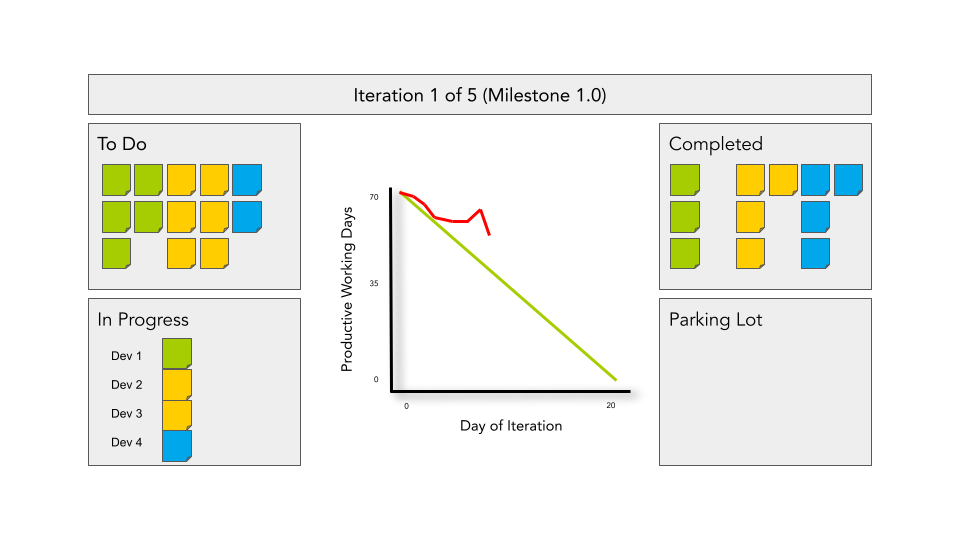
While Burndown Charts are excellent for keeping track of the completed work, they are often partnered with several other things on something known as The Big Board (although it might be known by other names where you work).
The Big Board brings together all the information a development team might need. It includes (but is not limited to):
- The current iteration (of total iterations in the milestone).
- All of the requirements (or user stories, or use cases) that need to be completed during the iteration. These are often written onto large stickies so they can be moved around the board as needed.
- All of the tasks that have been identified for each of the requirements. These are often written onto smaller stickies so they can be moved around the board as needed.
- A section labelled “To Do” (or something similar). All unassigned and not-in-progress requirements and tasks should be located here.
- A section labelled “In Progress” (or something similar). Assigned requirements and tasks are moved to this section. Developer names are often added to the sticky so everyone knows who is working on what.
- A section labelled “Completed” (or something similar). Only when all tasks for a requirement are complete should the large and small stickies be moved to this section. At the end of the day, the work completed will be used to update the Burn Down Chart.
- A parking lot for new requirements or tasks that have been identified. These might increase the amount of work to be completed in an iteration beyond what is expected of a team given their size and velocity.
When Is The Requirement/User Story Finished?
The answer to this question may vary depending on the standards of a given company. Regardless, you might want to ask the following questions before you move your requirement from the “In Progress” section of The Big Board to the “Completed” section:
- Have all of the coding tasks been completed?
- Have all unit tests been written?
- Have all unit tests been passed?
- Have code reviews been conducted?
- Have you checked for memory leaks?
In some cases, each requirement or user story will have an owner (likely the team leader or manager) who will decide if it has been successfully implemented. In this case, the owner should have identified the things they need to see before deciding whether the team has delivered the functionality required to implement the requirement/user story (such as being able to answer yes to the questions above). In other cases, the team might collectively review the work and decide it is finished.
Whatever the case, having well-written and measurable requirements will help you when it comes time to determine if you can move the work that’s been done from “In Progress” to “Completed”.
Activity: Working With The Burn Down Chart
In a perfect situation, how much work would you expect a team of 4 to produce given a velocity of 80% over three days of an iteration that lasts 20 days?
Given an iteration period of 20 days and a team of 4, how might you determine the true average velocity of the team between days 10 and 15?
Where do the requirements/tasks/user stories/use cases that are listed in the “to do” section of The Big Board come from?
What would you do if you still have work to be completed (either under the “To Do” or “In Progress” sections of The Big Board) at the theoretical end of your iteration?
If you were the team leader or the manager of several teams, what other information might you want on The Big Board, and why?