Ice Cream Structure
30 Structure from the Ice crystals
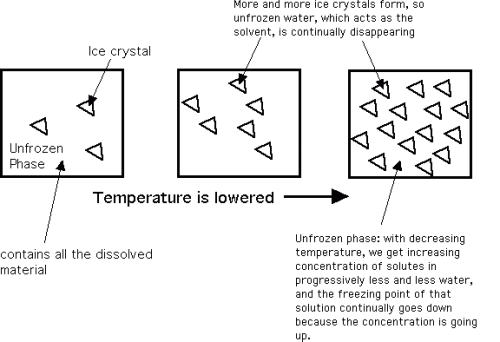
Also adding structure to the ice cream is the formation of the ice crystals. Water freezes out of a solution in its pure form as ice. In a sugar solution such as ice cream, the initial freezing point of the solution is lower than 0°C due to these dissolved sugars (freezing point depression), which is mostly a function of the sugar content of the mix. As ice crystallization begins and water freezes out in its pure form, the concentration of the remaining solution of sugar is increased due to water removal and hence the freezing point is further lowered. This process is shown here, schematically.

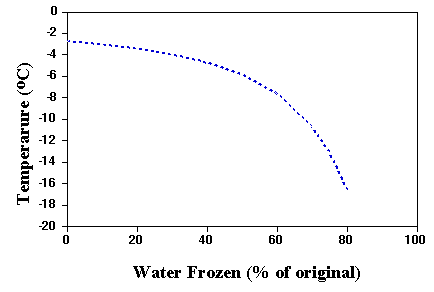
This process of freeze concentration continues to very low temperatures. Even at the typical ice cream serving temperature of -16°C, only about 72% of the water is frozen. The rest remains as a very concentrated sugar solution. Thus when temperature is plotted against % water frozen, you get the phase diagram shown below. This helps to give ice cream its ability to be scooped and chewed at freezer temperatures. The air content also contributes to this ability, as mentioned in discussing overrun.

The effect of sweeteners on freezing characteristics of ice cream mixes is demonstrated by the plot shown above.
Also critical to ice cream structure is ice crystal size, and the effect of recrystallization (heat shock, temperature fluctuations) on ice crystal size and texture. A primer on the theoretical aspects of freezing will help you to fully understand the freezing process. Please see the discussion and diagram on ice crystallization rate, as shown on that page, to fully understand this process. Recrystallization (growth) of ice is discussed elsewhere in the context of shelf life.
Thus the structure of ice cream can be described as a partly frozen foam with ice crystals and air bubbles occupying a majority of the space. The tiny fat globules, some of them flocculated and surrounding the air bubbles also form a dispersed phase. Proteins and emulsifiers are in turn surrounding the fat globules. The continuous phase consists of a very concentrated, unfrozen solution of sugars. One gram of ice cream of typical composition contains 1.5 x 10¹² fat globules of average diameter 1 µm that have a surface area of greater than 1 square meter (in a gram!), 8 x 10⁶ air bubbles of average diameter 70 µm with a surface area of 0.1 sq. m., and 8 x 10⁶ ice crystals of average diameter 50 µm with a surface area of another 0.1 sq. m. The importance of surface chemistry becomes obvious!

