2.2 The Economic Environment
This category is one of the most important external influences on businesses. Fluctuations in the level of economic activity create business cycles that affect businesses and individuals in many ways. When the economy is growing, for example, unemployment rates are low, and income levels rise. Inflation and interest rates are other areas that change according to economic activity. Through the policies it sets, such as taxes and interest rate levels, a government attempts to stimulate or curtail the level of economic activity. In addition, the forces of supply and demand determine how prices and quantities of goods and services behave in a free market.
Measuring the Health of the Economy
Every day, we are bombarded with economic news (at least if you watch the business news stations). We’re told about things like unemployment, home prices, and consumer confidence trends. As a student learning about business, and later as a business manager, you need to understand the nature of the Canadian economy and the terminology that we use to describe it. You need to have some idea of where the economy is heading, and you need to know something about the government’s role in influencing its direction.
Economic Goals
The world’s economies share three main goals:
- Growth
- High employment
- Price stability
Let’s take a closer look at each of these goals, both to find out what they mean and to show how we determine whether they’re being met.
Economic Growth
One purpose of an economy is to provide people with goods and services—cars, computers, video games, houses, rock concerts, fast food, amusement parks. One way in which economists measure the performance of an economy is by looking at a widely used measure of total output called the gross domestic product (GDP). The GDP is defined as the market value of all goods and services produced by the economy in a given year. The GDP includes only those goods and services produced domestically; goods produced outside the country are excluded. The GDP also includes only those goods and services that are produced for the final user; intermediate products are excluded. For example, the silicon chip that goes into a computer (an intermediate product) would not count directly because it is included when the finished computer is counted. By itself, the GDP doesn’t necessarily tell us much about the direction of the economy. But change in the GDP does. If the GDP (after adjusting for inflation, which will be discussed later) goes up, the economy is growing. If it goes down, the economy is contracting. There is some debate amongst economists that GDP provides the most accurate measure of an economy’s performance. Many economists believe that GDP per capita, which is the measure of total production of goods and services divided by the number of households, is a better indicator of an economy’s performance. For example, according to The World Bank, as of 2024, India’s GDP is $3.55 trillion (USD) while Canada’s GDP is $2.14 trillion (USD). However, as of 2024, Canada’s GDP per capita is $53,371.7 per household, compared to India’s GDP per capita is $2,484.8 per household.
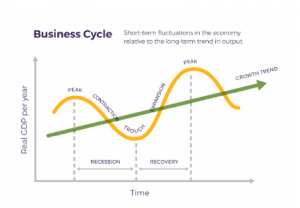
The economic ups and downs resulting from expansion and contraction constitute the business cycle. Similar to a product lifecycle, as a business cycle introduces new products, those products grow, mature and decline, when all business cycles in an economy are combined it creates an economy’s business cycle. A typical cycle runs from three to five years but could last much longer. Though typically irregular, a cycle can be divided into four general phases of prosperity, recession, depression (which the cycle generally skips), and recovery:
- During prosperity, the economy expands, unemployment is low, incomes rise, and consumers buy more products. Businesses respond by increasing production and offering new and better products.
- Eventually, however, things slow down. GDP decreases, unemployment rises, and because people have less money to spend, business revenues decline. This slowdown in economic activity is called a recession.
- Economists often say that we’re entering a recession when GDP goes down for two consecutive quarters.
- Generally, a recession is followed by a recovery or expansion in which the economy starts growing again.
- If, however, a recession lasts a long time (perhaps a decade or so), while unemployment remains very high and production is severely curtailed, the economy could sink into a depression. Unlike for the term recession, economists have not agreed on a uniform standard for what constitutes a depression, though they are generally characterized by their duration. Though not impossible, it’s unlikely that the United States will experience another severe depression like that of the 1930s. The federal government has a number of economic tools (some of which we’ll discuss shortly) with which to fight any threat of a depression.
The Unemployment Rate
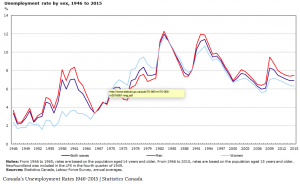
Statistics Canada tracks unemployment and reports the unemployment rate: the percentage of the labour force that’s unemployed and actively seeking work. The unemployment rate is an important measure of economic health. It goes up during recessionary periods because companies are reluctant to hire workers when demand for goods and services is low. Conversely, it goes down when the economy is expanding and there is high demand for products and workers to supply them.
“The Canadian Unemployment Rate, 1946–2015” traces the Canadian unemployment rate between 1946 and 2015. Please be aware that there are multiple measures of unemployment and that this graph is based on what is known as R4, the most commonly used measurement and is comparable to the U.S. unemployment measure, U3. Another measurement, R8, is considered to provide a broader picture of unemployment in Canada and includes unemployed workers that are discouraged by their job search, involuntary part-time workers and those unemployed workers that are awaiting confirmation for new work. Since by definition, R8 is always higher than R4, it is likely that R4 is discussed more often because it paints a more favourable, if not completely accurate, picture.
Full Employment
To keep the economy going strong, people must spend money on goods and services. A reduction in personal expenditures for things like food, clothing, appliances, automobiles, housing, and medical care could severely reduce GDP and weaken the economy. Because most people earn their spending money by working, an important goal of all economies is making jobs available to everyone who wants one. In principle, full employment occurs when everyone who wants to work has a job. In practice, we say that we have full employment when about 95 percent of those wanting to work are employed.
Price Stability
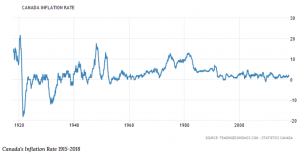
A third major goal of all economies is maintaining price stability. Price stability occurs when the average of the prices for goods and services either doesn’t change or changes very little. Rapidly rising prices are troublesome for both individuals and businesses. For individuals, rising prices mean people have to pay more for the things they need. For businesses, rising prices mean higher costs, and, at least in the short run, businesses might have trouble passing on higher costs to consumers. When the overall price level goes up, we have inflation. The graph shows inflationary trends in the Canadian economy between 1915 and 2015. The inflation rate in Canada averaged 3.15 percent from 1915 until 2018, reaching an all-time high of 21.60 percent in June of 1920 and a record low of -17.80 percent in June of 1921.
The Consumer Price Index
The most widely publicized measure of inflation is the consumer price index (CPI), which is reported monthly by Statistics Canada. The CPI measures the rate of inflation by determining price changes of a hypothetical basket of goods, such as food, housing, clothing, medical care, appliances, automobiles, and so forth, bought by a typical household.
The Bank of Canada currently measures prices against the base year of 2002, and the basket for that year is given the value of 100. In 2012 the CPI averaged 121.7, which means that what you could buy for $100 in 2002 cost $121.70 in 2012. The difference registers the effect of inflation. In fact, that’s what an inflation rate is—the percentage change in a price index.
Economic Forecasting
In the previous section, we introduced several measures that economists use to assess the performance of the economy at a given time. By looking at changes in the GDP, for instance, we can see whether the economy is growing. The CPI allows us to gauge inflation. These measures help us understand where the economy stands today. But what if we want to get a sense of where it’s headed in the future? To a certain extent, we can forecast future economic trends by analyzing several leading economic indicators.
Economic Indicators
An economic indicator is a statistic that provides valuable information about the economy. There’s no shortage of economic indicators, and trying to follow them all would be an overwhelming task. So in this chapter, we’ll only discuss the general concept and a few of the key indicators.
Lagging and Leading Indicators
Statistics that report the status of the economy a few months in the past are called lagging economic indicators. One such indicator is average length of unemployment. If unemployed workers have remained out of work for a long time, we may infer that the economy has been slow. Indicators that predict the status of the economy three to twelve months into the future are called leading economic indicators. If such an indicator rises, the economy is more likely to expand in the coming year. If it falls, the economy is more likely to contract.
It is also helpful to look at indicators from various sectors of the economy – labour, manufacturing, and housing. One useful indicator of the outlook for future jobs is the number of new claims for unemployment insurance. This measure tells us how many people recently lost their jobs. If it’s rising, it signals trouble ahead because unemployed consumers can’t buy as many goods and services as they could if they had paycheques.
To gauge the level of goods to be produced in the future (which will translate into future sales), economists look at a statistic called average weekly manufacturing hours. This measure tells us the average number of hours worked per week by production workers in manufacturing industries. If it’s on the rise, the economy will probably improve. For assessing the strength of the housing market, housing starts is often a good indicator. An increase in this statistic—which tells us how many new housing units are being built—indicates that the economy is improving. Why? Because increased building brings money into the economy not only through new home sales but also through sales of furniture and appliances to furnish them.
Since employment is such a key goal in any economy, the Canadian Industry Statistics in collaboration with Statistics Canada tracks total non-farm payroll employment from which the number of net new jobs created can be determined.
Government’s Role in Managing the Economy
Monetary Policy
Monetary policy is exercised by the Bank of Canada, which is empowered to take various actions that decrease or increase the money supply and raise or lower short-term interest rates, making it harder or easier to borrow money. When the Bank of Canada believes that inflation is a problem, it will use contractionary policy to decrease the money supply and raise interest rates. When rates are higher, borrowers have to pay more for the money they borrow, and banks are more selective in making loans. Because money is “tighter”—more expensive to borrow—demand for goods and services will go down, and so will prices. In any case, that’s the theory.
The Bank of Canada will typically tighten or decrease the money supply during inflationary periods, making it harder to borrow money.
To counter a recession, the Bank of Canada uses expansionary policy to increase the money supply and reduce interest rates. With lower interest rates, it’s cheaper to borrow money, and banks are more willing to lend it. We then say that money is “easy.” Attractive interest rates encourage businesses to borrow money to expand production and encourage consumers to buy more goods and services. In theory, both sets of actions will help the economy escape or come out of a recession.
Fiscal Policy
Fiscal policy relies on the government’s powers of spending and taxation. Both taxation and government spending can be used to reduce or increase the total supply of money in the economy—the total amount, in other words, that businesses and consumers have to spend. When the country is in a recession, government policy is typically to increase spending, reduce taxes, or both. Such expansionary actions will put more money in the hands of businesses and consumers, encouraging businesses to expand and consumers to buy more goods and services. Expansionary fiscal policy is used to increase government expenditures and/or decrease taxes which causes the government’s budget deficit to increase or its budget surplus to decrease. When the economy is experiencing inflation, the opposite policy is adopted: the government will decrease spending or increase taxes, or both. Because such contractionary measures reduce spending by businesses and consumers, prices come down and inflation eases. Contractionary fiscal policy is used to decrease government expenditures and/or increase taxes which causes the government’s budget deficit to decrease or its budget surplus to increase.
The National Debt
If, in any given year, the government takes in more money (through taxes) than it spends on goods and services (for things such as defense, transportation, and social services), the result is a budget surplus. If, on the other hand, the government spends more than it takes in, we have a budget deficit (which the government pays off by borrowing through the issuance of Treasury bonds). Historically, deficits have occurred much more often than surpluses; typically, the government spends more than it takes in. Consequently, the Canadian government now has a total national debt of more than $1.430 trillion.
This number is moving too quickly for the authors to keep the graph current – you can see the current debt at https://www.nationaldebtclocks.org/debtclock/canada.
