9.4 Analyzing Financial Statements
Now that you know a bit about financial statements, let’s see how they’re used to help owners, managers, investors, and creditors assess a firm’s performance and financial strength. You can glean a wealth of information from financial statements, but first, you need to learn a few basic principles for “unlocking” it.
Trend Analysis from the Income Statement
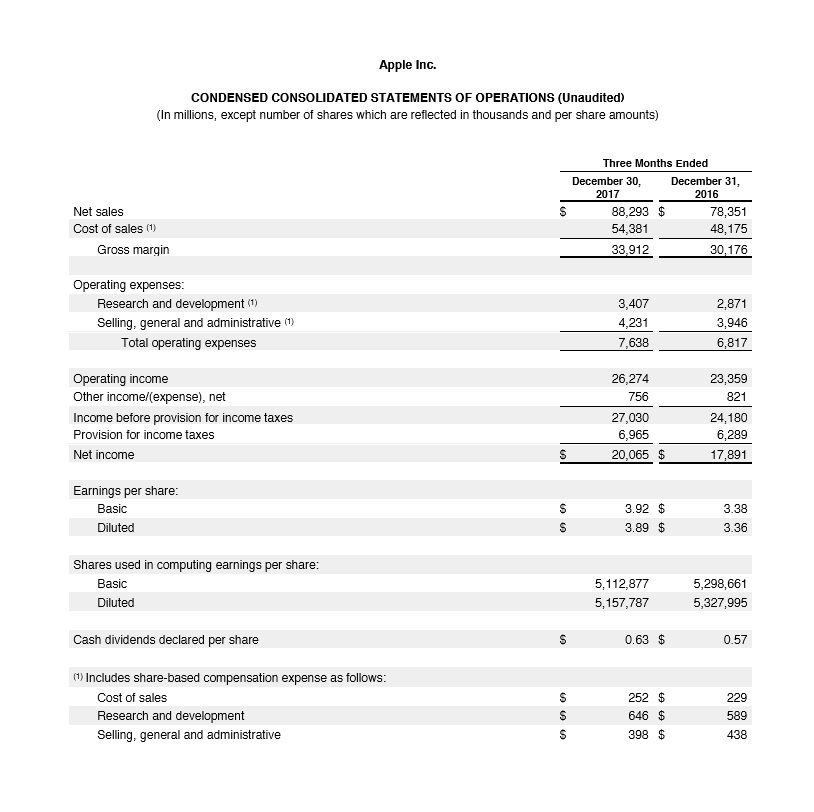
Peruse an abbreviated financial statement for Apple for 2017 taken directly from their website. You will note that instead of showing only the current year’s results, the company has shown data for the prior year as well.
From this relatively simple exhibit, considerable information about Apple’s performance can be obtained.
For example:
- Apple sales grew at 12.7% from 2016 to 2017, not bad for a company with such a large base of sales already, but certainly not the rapid-growth company it once was. When making yearly comparisons, this is commonly referred to as performing a horizontal analysis.
- Net income as a percent of sales (a ratio also known as return on sales) was 22.7% in 2017 – or in other words, for every $5 in sales, Apple turned more than $1 of it into profit. That is substantial! When calculating ratios as a percent of a larger figure (i.e., Net income as a percent of sales, or cash as a percent of Total Assets) this is commonly referred to as performing a vertical analysis.
Many other calculations are possible from Apple’s data, and we will look at a few more as we explore ratio analysis.
Ratio Analysis
How do you compare Apple’s financial results with those of other companies in your industry or with the other companies whose stock is available to investors? And what about your balance sheet? Are there relationships on this statement that also warrant investigation? These issues can be explored by using ratio analysis, a technique for evaluating a company’s financial performance.
Remember that a ratio is just one number divided by another, with the result expressing the relationship between the two numbers. It’s hard to learn much from just one ratio, or even a number of ratios covering the same period. Rather, the deeper value in ratio analysis lies in looking at the trend of ratios over time and in comparing the ratios for several time periods with those of other companies. There are a number of different ways to categorize financial ratios.
Here are a few sets of categories:
- Profitability ratios: These tell you how much profit is made relative to the amount invested (return on investment) or the amount sold (return on sales).
- Liquidity ratios: These tell you how well-positioned a company is to pay its bills in the near future. Liquidity refers to how quickly an asset can be turned into cash. For example, share of stock is substantially more liquid than a building or a machine.
- Debt ratios: These look at how much borrowing a company has done in order to finance the operations of the business. The more borrowing, the more risk/debt a company has taken on, and so the less likely it would be for new lenders to approve loan applications.
- Efficiency ratios: These tell you how well your assets are being managed.
We could employ many different ratios, but we’ll focus on a few key examples.
Profitability Ratios
Earlier we looked at the return on sales for Apple. Another profitability ratio on which the financial markets focus is earnings per share, also known as EPS. This ratio divides net income by the number of shares of stock outstanding. According to the earlier exhibit, Apple saw its EPS increase from $3.38 in 2016 to $3.92 in 2017, which indicates a profit of about 15%; an excellent return for a company that is already among the world’s largest. Well-paid analysts will spend hours to understand how these results were achieved every time Apple issues new financial statements.
Liquidity Ratios
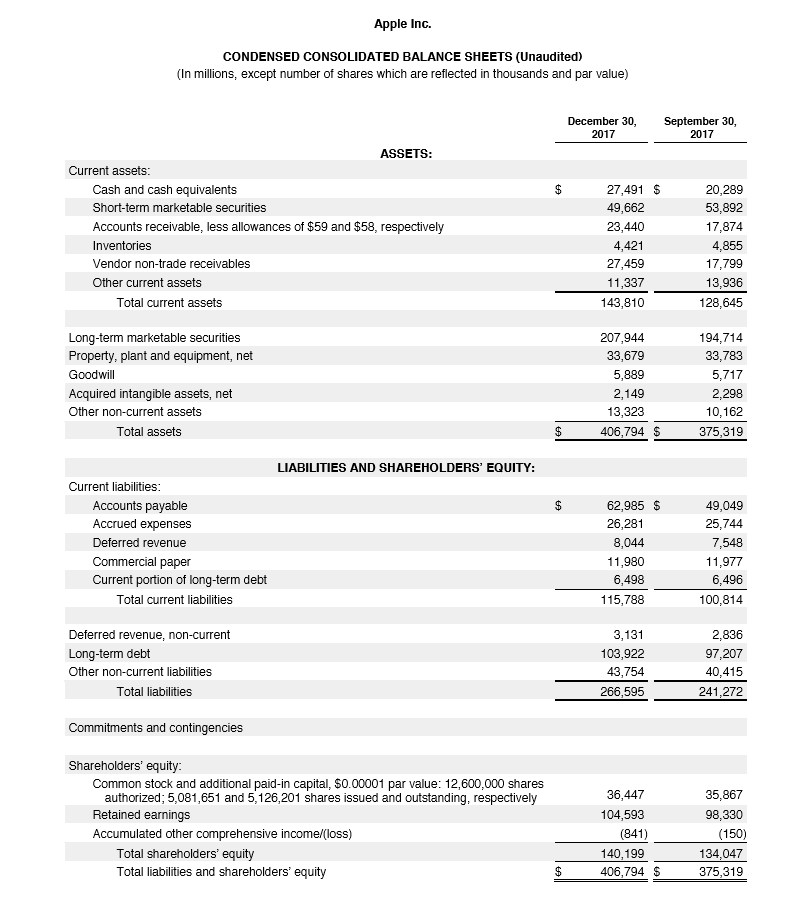
Liquidity ratios are one element of measuring the financial strength of a company. They assess its ability to pay its current bills. A key liquidity ratio is called the current ratio. It simply examines the relationship between a company’s current assets and its current liabilities. On December 30, 2017 (remember that balance sheets reflect a point in time), Apple had $68.5 billion in current assets and $63.5 billion in current liabilities. Simply, what this means is that Apple has more money on hand than they need to pay their bills. When a company has a current ratio greater than 1, they are in good shape to pay their bills; companies selling to Apple on credit would not need to worry that it is likely to run out of money.
Apple’s current ratio = $68.5 Billion / $63.5 Billion = 1.08 (greater than >) 1
Now, let’s quickly look at something that is not part of the ratio; look down one line on the balance sheet to long-term marketable securities and see that Apple owns $207.9 billion. While they are long-term and so not part of the current ratio, these securities are still easily convertible to cash. So Apple has far more cushion than the current ratio reflects, even though it reflected a healthy financial position already.
Debt Ratios
A key debt ratio, which tells us how the company is financed, is the debt-to-equity ratio, which calculates the relationship between funds acquired from creditors (debt) and funds invested by owners (equity). For this ratio calculation, we use Apple’s total liabilities, not just the line on the balance sheet that says long-term debt, because, in effect, Apple is borrowing from those who it owes but has not yet paid. Apple’s total liabilities at the end of 2017 were $266.6 billion versus owner’s equity of $140.2 billion, a ratio of 1.9, which means Apple has borrowed more than it has invested in the business.
Apple’s debt to equity ratio: $266.6 / $140.2 Billion = 1.9
To some investors, that high level of debt might seem alarming. But remember that Apple has $207.9 billion invested in marketable securities. If it wished to do so, Apple could sell some of those securities and pay down its debts, thus improving its ratio. It’s likely that anyone thinking about lending money to Apple and seeing these figures would be confident that Apple has the ability to pay back what they borrow.
Efficiency and Effectiveness Ratios
There are many more ratios that we could apply to Apple to more completely understand its performance. Yet going deeper into ratios would be beyond the scope of an introductory business course. If you continue your study of business, you will get ample exposure to these ratios in your accounting and finance courses. So we’ll leave the rest for another day.
