8.6 Operations Scheduling
To control the timing of all operations, managers set up schedules: they select jobs to be performed during the production process, assign tasks to workgroups, set timetables for the completion of tasks, and make sure that resources will be available when and where they’re needed. There are a number of scheduling techniques. We’ll focus on two of the most common—Gantt and PERT charts.
Gantt Charts
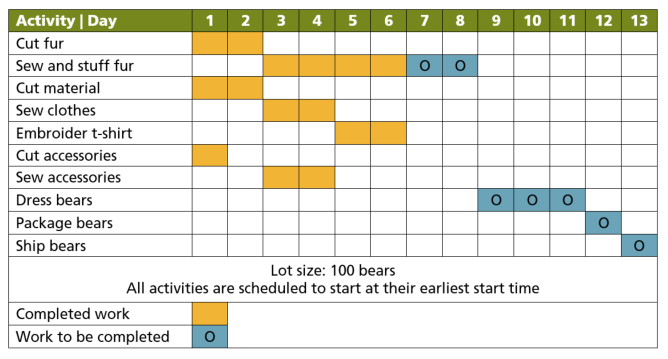
A Gantt chart, named after the designer, Henry Gantt, is an easy-to-use graphical tool that helps operations managers determine the status of projects. Let’s say that you’re in charge of making the “hiking bear” offered by the Toronto Teddy Bear Company. Below is a Gantt chart for the production of one hundred of these bears. As you can see, it shows that several activities must be completed before the bears are dressed: the fur has to be cut, stuffed, and sewn; and the clothes and accessories must be made. Our Gantt chart tells us that by day six, all accessories and clothing have been made. The sewing and stuffing, however (which must be finished before the bears are dressed), isn’t scheduled for completion until the end of day eight. As operations manager, you’ll have to pay close attention to the progress of the sewing and stuffing operations to ensure that finished products are ready for shipment by their scheduled date.
PERT Charts
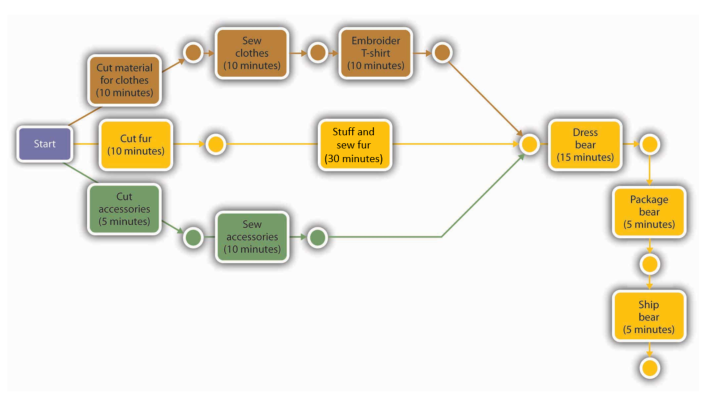
Gantt charts are useful when the production process is fairly simple and the activities aren’t interrelated. For more complex schedules, operations managers may use PERT charts. PERT (which stands for Program Evaluation and Review Technique) is designed to diagram the activities required to produce a good, specify the time required to perform each activity in the process, and organize activities in the most efficient sequence. It also identifies a critical path: the sequence of activities that will entail the greatest amount of time. Below is a PERT diagram showing the process for producing one “hiker” bear at Toronto Teddy Bear.
Our PERT chart shows how the activities involved in making a single bear are related. It indicates that the production process begins at the cutting station. Next, the fur that’s been cut for this particular bear moves first to the sewing and stuffing stations and then to the dressing station. At the same time that its fur is moving through this sequence of steps, the bear’s clothes are being cut and sewn and its T-shirt is being embroidered. Its backpack and tent accessories are also being made at the same time. Note that fur, clothes, and accessories all meet at the dressing station, where the bear is dressed and outfitted with its backpack. Finally, the finished bear is packaged and shipped to the customer’s house.
What was the critical path in this process? The path that took the longest amount of time was the sequence that included cutting, stuffing, dressing, packaging, and shipping—a sequence of steps taking sixty-five minutes. If you wanted to produce a bear more quickly, you’d have to save time on this path. Even if you saved the time on any of the other paths, you still wouldn’t finish the entire job any sooner: the finished clothes would just have to wait for the fur to be sewn and stuffed and moved to the dressing station. We can gain efficiency only by improving our performance on one or more of the activities along the critical path.