Composition and Yield Control
20 Composition Control
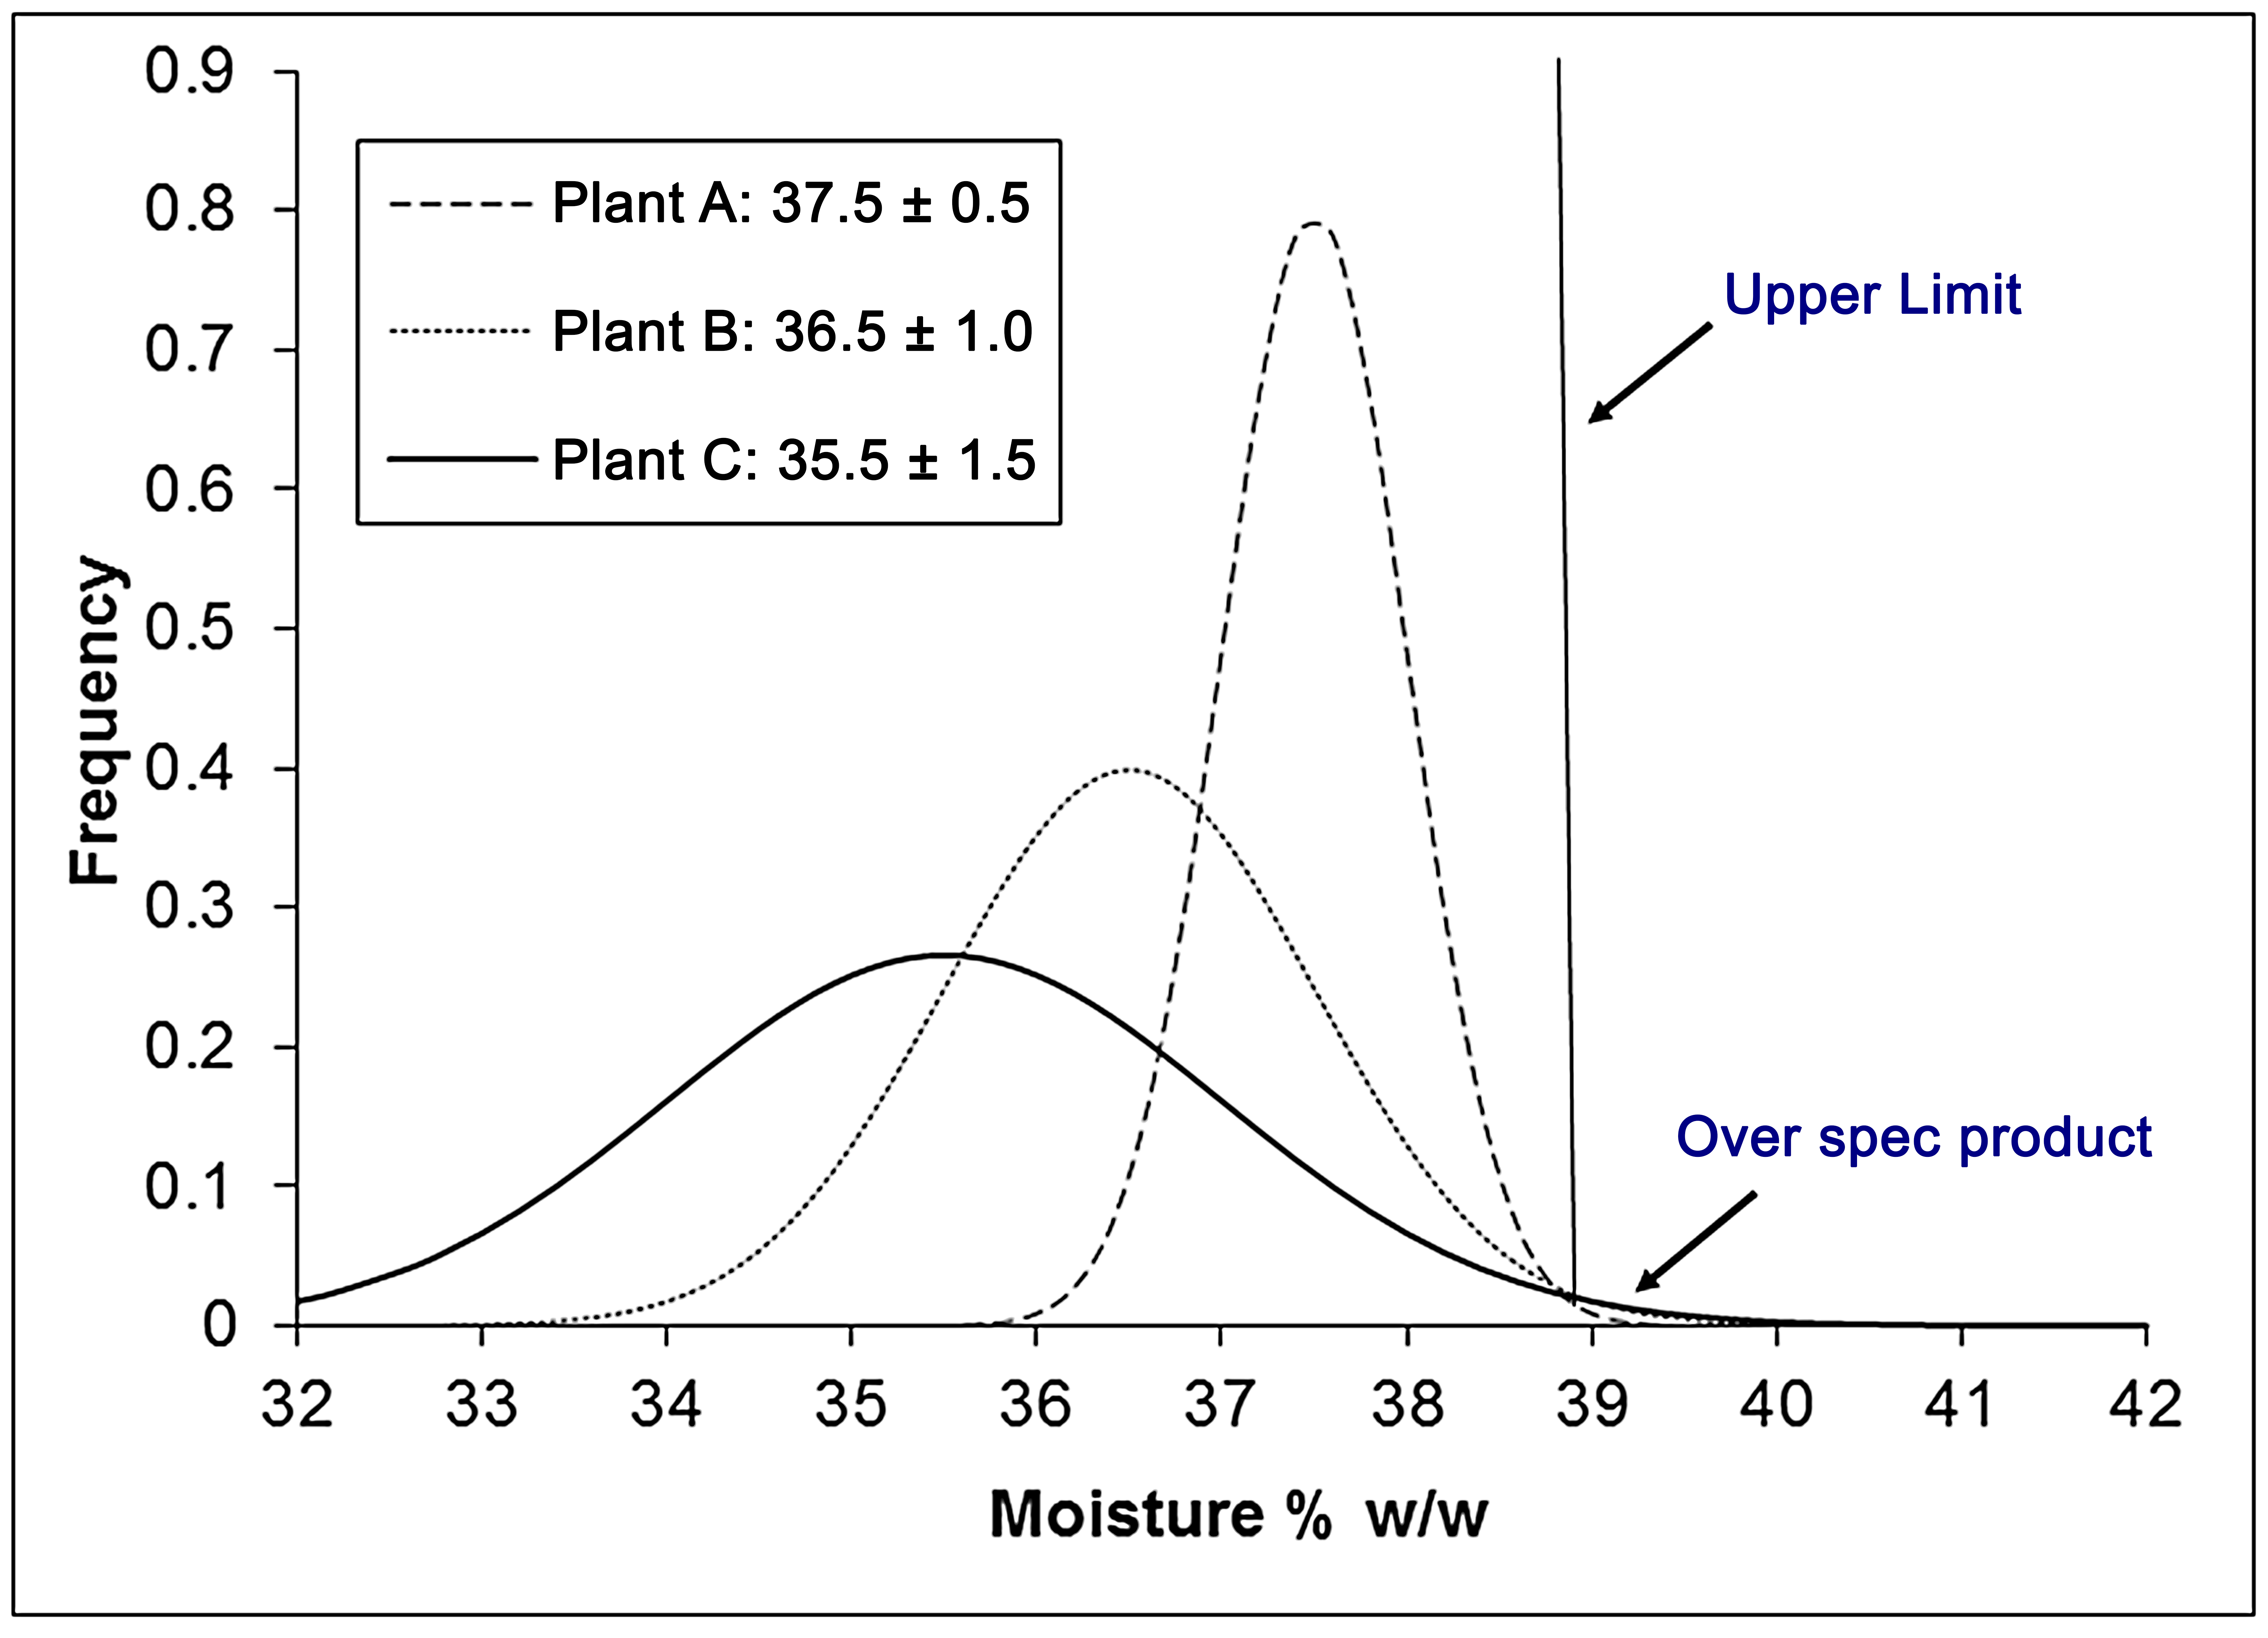
The importance of composition control is illustrated for moisture in Figure 20.1 and Table 20.1. Control of other composition parameters is also critical to the bottom line (salt, fat, etc.). Plant 1 in Table 20.1 has low Standard Deviation (SD) and good accuracy; the average moisture is close to the target and the SD is low, losses for lower-than-desired yields are minimum and over the spec products (which translate in regulatory and quality issues) are minimum. Plant 2 has higher SD with good accuracy. Considering the legal maximum for Cheddar is 39%, the moisture is unlikely to exceed the legal limit in spite of the higher SD. Plant 3 has a mid-range SD, but is consistently missing the target moisture; the average moisture is 1.79% lower than the target translating in monetary loss.
Figure 20.1 shows how variation in moisture content forces the cheese maker to target lower moisture content. This causes lower average yields and potentially reduced quality. Plant C has the highest variation, so, to avoid over-target moisture in some vats, the plant is forced to lower the target moisture. Plant A has the lowest standard deviation and is, therefore, able to target higher moisture to optimize yield.
Table 20.2 illustrates the common problem of composition gradients in large blocks of cheese at 5°C for 7 days. These gradients may cause differences in quality and some may persist long enough to result in cheese that exceeds the desirable or legal moisture content. The table shows the extreme example of large blocks (290 Kg) of Cheddar, but composition gradients occur in all cheese.
Table 20.1: Examples showing high, medium, and low levels of Cheddar moisture control
| Plant 1 | Plant 2 | Plant 3 | |
| Mean Cheese Moisture | 38.10 | 37.24 | 35.63 |
| Standard Deviation | 0.554 | 1.038 | 0.959 |
| Target Value | 38.09 | 37.29 | 37.42 |
| Mean Minus Target | +0.01 | -0.04 | -1.79 |
| Level of Control | High | Medium | Low |
(Lacroix, Verret, and Emmons, 1991)
Table 20.2: Variation of composition in 290 Kg blocks of stirred curd Cheddar cheese. Samples were taken from 6 positions in stainless steel hoops after holding at 5ºC for 7 days after pressing.
| Center | Side | Upper corner | |
| Salt | 1.3 | 1.6 | 1.5 |
| Moisture | 36.04 | 42.50 | 41.07 |
| pH | 5.10 | 5.18 | 5.25 |
| T at 24 h | 35ºC | 8ºC | Not reported |
(Reinbold and Ernstrom, 1988)