
Process and Quality Control Procedures
7 pH and Titratable Acidity
1. Concepts of Acidity and pH
All aqueous systems (including the water in you and in cheese) obey the following relationship between the concentration of hydrogen ions (H+) and hydroxyl ions (OH–). Note: the square brackets indicate concentration in moles per litre. A mole is 6 x 10²³ molecules, that is, the numeral six with 23 zeros after it.
![[H^+] \times [OH^-] = 10^{-14} \:\:\:\:\:(1)](https://books.lib.uoguelph.ca/app/uploads/quicklatex/quicklatex.com-0a76f75cd0833f1db47ef38ccd0da9fe_l3.png "Rendered by QuickLaTeX.com")
Because the actual concentrations in moles per litre are small, it is customary to express the values as exponents. For example, if we know that the concentration of hydrogen ions [H+] in a sample of milk is 0.000001 moles/L which is equivalent to 10-6 moles/L, we can calculate the concentration of hydroxyl ions as 10-14/10-6 = 10-8 moles/L which is the same as 0.00000001 moles/L. Similarly, if [H+] is 10-7, we can calculate that [OH–] is also 10-7.
It follows then that:
- If [H+] = [OH–] the solution is neutral with respect to acidity.
- If [H+] > [OH–] the solution is acidic.
- If [H+] < [OH–] the solution is basic or alkaline.
- Chemicals which contribute H+ or absorb OH– are acids, while bases contribute OH– or absorb H+.
The concept of pH evolved as a short hand method to express acidity. We have already seen that a hydrogen ion concentration of 0.000001 moles/L can be expressed as [1 x10⁻⁶], an expression which defines both the unit of measurement (the square bracket means concentration in moles/L) and the numerical value. The concept of pH is a further abbreviation which expresses the concentration of hydrogen ions as the negative log of the hydrogen ion concentration in units of moles/L, which is expressed by the following equation:
![pH = -log[H^+]\:\:\:\:\:(2)](https://books.lib.uoguelph.ca/app/uploads/quicklatex/quicklatex.com-e7de495017e15385898f0864805d911f_l3.png "Rendered by QuickLaTeX.com")
This sounds complex but is quite easy to apply. For example, the log10 of hydrogen ion concentration of [10-6] is equal to -6. The final step is to take the negative of the log (-1 x -6 = 6). So, 0.0000001 moles/L = [10-6] moles/L = pH 6. Using equation 1 above, if the concentration of either OH– or H+ is known, it is always possible to calculate the concentration of the other. So, if the pH of a solution is 6, the pOH is 14 – 6 = 8. Because this relationship is understood (well, OK, at least understood by the chemists!), the convention is to only report pH. Note: that because the negative sign was dropped for convenience, decreasing pH values mean increasing acidity, or increasing concentration of H+ ions. So, although TA and pH are both measures of acidity, pH decreases with increasing acidity.
All of this can be summarized with a description of the pH scale. The pH scale for most practical purposes is from 1 to 14, although pH less than one is theoretically and practically possible.
pH = 7.0 is neutral acidity where [H+] = [OH–]
pH < 7.0 is acid condition where [H+] > [OH–]
pH > 7.0 is alkaline or basic condition where [H+] < [OH–]
2. Buffer Capacity
Buffer capacity is the ability of an aqueous system, such as milk, to resist changes in pH with addition of acids (added H+) or bases (added OH–). Specifically, buffer capacity is the amount of acid or base required to induce a unit change in pH. For example, a small addition of acid to distilled water will cause a large reduction in pH. The same amount of acid would have a small effect on the pH of milk, because milk proteins and salts neutralize the acidity.
The two most important buffer components of milk are caseins (buffer maximum near pH 4.6 – 5.2) and phosphate (buffer maximum near pH 7.0). The casein buffer maximum near pH 5.0 is extremely important to cheese manufacture because the optimal minimum pH for most cheese is in the range of 5.0 – 5.3. As the pH of cheese is reduced towards pH 5.0 by lactic acid fermentation, the buffer capacity is increasing (i.e., each incremental decrease in pH requires more lactic acid). The effect is to give the cheese maker considerable room for variation in the rate and amount of acid production. Without milk’s built-in buffers, it would be difficult to produce cheese in the optimum pH range.
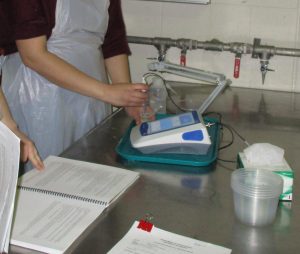
3. pH Measurement
The pH of cheese milk, whey, and soft cheese can be measured directly. Firm and hard cheese must be fragmented before analysis. Always measure cheese pH in duplicate and use care in handling the electrode. Place the fragmented cheese in a 30 ml vial or a small beaker and gently push the electrode into the cheese – too much haste is likely to break the electrode on the bottom of the beaker. To ensure good contact, press the cheese around the electrode with your fingers. There is no need to rinse the electrode between similar samples. However, if the electrode is stored in buffer it should be rinsed with water before measuring cheese pH. Always store the electrode in a special potassium chloride solution designed for that purpose. Do not rub the electrode. The electrode should be washed with detergent and rinsed with acetone occasionally to remove fat and protein deposits.
Since it is difficult to measure cheese directly with a protected electrode, an alternative to packing fragmented cheese around an electrode is to stir fragmented cheese in some distilled water and measure the pH of the mixture.
4. Titratable Acidity vs. pH
Tritratable acidity (TA) and pH are both measures of acidity but, for most purposes, pH is a better process control tool because the pH probe measures only those H+ that are free in solution and not associated with salts or proteins. This is important because it is the free H+ ions that directly affect quality parameters such as sour taste and protein functionality. The pH also directly affects microbial growth and survival, so pH, rather than TA is the best indicator of the preservation and safety effects of acidity. pH is the most important factor available to the cheese maker to control spoilage and pathogenic organisms. Accordingly, the pH history of the milk and cheese or whey is important troubleshooting information. Cheese moisture, mineral content, texture, and flavour development are all influenced directly by pH.
In contrast, TA measures not only the free hydrogen ions, but also hydrogen ions associated with organic acids and proteins. This means, for example, that TA of fresh good quality milk varies from about 0.12 to about 0.25% lactic acid equivalents depending mainly on the protein content in the milk. However, the pH of fresh good quality milk will always be in the range of 6.6 to 6.8, which is the same pH as the blood of all mammals. Similar differences occur during cheese manufacture; the pH gives a true indication of acid development during the entire process, so the optimum pH at each step is independent of other variables. However, the optimum TA at each step in cheese making will vary with initial milk composition, milk heat treatments, and the procedure used to standardize milk composition.
An illustration of the difference between TA and pH is the effect of cutting. Up to the time of cutting, TA of the milk increases with the development of acidity by the culture. After cutting, the TA of the whey is much lower. This does not mean that acid development stopped, but that titratable H+ ions associated with the milk proteins are not present in the whey. This leads to the concept of buffer capacity, which is an important principle in cheese making. The effect of protein removal on the TA of whey is related to the ability of protein to “buffer” the milk against changes in pH. That same buffering property is the reason it helps to take acidic medication, like aspirin, with milk.
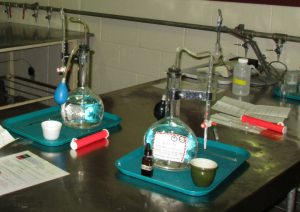
5. Titratable Acidity
Apparatus and Reagents
- An acidimeter equipped with a burette graduated in units of 0.1 ml up to 10 ml, and some means of filling the sample without undue exposure of the solution to the carbon dioxide of the atmosphere.
- N/10 sodium hydroxide solution.
- A dropping bottle containing a 1% alcoholic phenolphthalein solution.
- White cup, glass stirring rod, 17.6 ml pipette (or 8.8 ml or 9.0 ml pipette)
Method
- Mix sample thoroughly by pouring it from one container to another. The temperature of the sample should be near 20ºC.
- Pipette 17.6 ml of milk or cream into a white cup. Note: 8.8 ml pipettes may also be used but are no longer as readily available as 17.6 ml pipettes. Readily available 9 ml pipettes may also be used.
- Add six drops of phenolphthalein indicator solution to milk, or 10 drops if the product is cream.
- Titrate the sample with the N/10 sodium hydroxide solution (0.1 Normal NaOH) while stirring the sample with the glass rod. Look for the appearance of a faint pink colour, which signals the endpoint. Add another drop or half a drop of NaOH if the pink colour does not persist for 30 s.
- Record the number of ml of NaOH used to reach the endpoint. This value is called the “titer”. Titratable acidity reported as percent lactic acid is dependent on the volume of sample.
For the 8.8 ml pipette: 
For the 17.6 ml pipette: 
For the 9.0 ml pipette: 
Note: that there is practically no lactic acid in fresh milk, but it is customary to report TA in terms of % lactic acid because the difference in TA during cheese making is entirely due to production of lactic acid.
Application Notes
Both titratable acidity (TA) and pH are measures of acidity, but for most process control purposes, pH is a more useful measurement. Some cheese makers, however, still use TA to monitor initial acid development (that is, to check for culture activity) during the first hour after adding the culture. For this purpose, TA is a more reliable indicator because relative to pH measurement, it is more sensitive to small changes in milk acidity.
When using TA to monitor initial culture activity, note that:
- You are looking for a measurable increase in TA to confirm that the culture is active.
- Different people will interpret the colour endpoint differently, so it is important that the same person takes both the initial and final TA measurements.
- The principal divisions on most acidimeters are units of 0.1% lactic acid with subdivisions corresponding to 0.01% lactic acid. It is possible to interpolate between the subdivisions to obtain readings to the third decimal place. In practice, for most analysts, the sensitivity is about 0.005% lactic acid. That means it is possible to reliably measure a change in TA of 0.005% lactic acid. So, if the TA increase is greater than 0.005%, you can conclude that the culture is active. In most cases, TA increases in the range of 0.005% to 0.010% are obtained after 30-60 minutes of ripening (that is, 30-60 minutes after adding the lactic cultures).
- If you are using a bulk culture, it is critical to take the initial TA reading after the culture is added, because the culture is acidic and will increase the initial reading.
Finally, a comment on units is in order. The TA procedure is designed so that using an 8.8 mL sample pipette and titrating with 0.1 N NaOH from a pipette graduated in mL, produces a result in % lactic acid. It is common for cheese makers in North America to report % lactic acid x 100. So, instead of 0.16 %, they say 16 hundredths or just 16. In Europe it’s common to state TA in units of Degrees Dornic (D). One Dornic degree is equivalent to 0.1 g of lactic acid per liter or 0.01% lactic acid. So going back to the previous example, 0.16% lactic acid is equivalent to 160D.
