Milk
9 Raw Milk Composition and Quality
1. The Principal Milk Components
Cheese can be made from the milk of all ruminants including goats, sheep, buffalos, reindeer, yaks, llamas, and camels, although camels and llamas are not true ruminants. The milk of ruminants is the best milk for cheese making because it contains high levels of casein, a protein required to form an adequate coagulum for cheese making. Our consideration of milk composition will include only a summary of the proximate analyses of the most common dairy species and a few relevant, with respect to cheese making, comments about each component.
Gross composition of food (also referred to as proximate analysis) includes the total amounts of fats, proteins, carbohydrates, ash (mainly minerals, such as calcium) and moisture or total solids. Typical composition values for cow, sheep, water buffalo, and goat milk are listed in Table 9.1. Further discussion refers only to cow milk unless otherwise stated.
Table 9.1: Typical gross composition (Kg/100 Kg) of cow, dairy sheep, water buffalo, and goat milk
| Cow | Dairy Sheep | Water Buffalo | Goat | |
| Fat | 3.9 | 7.2 | 7.4 | 4.5 |
| Total Protein | 3.3 | 4.6 | 3.8 | 3.2 |
| Casein | 2.6 | 3.9 | 3.2 | 2.6 |
| Whey | 0.7 | 0.7 | 0.6 | 0.6 |
| Lactose | 4.6 | 4.8 | 4.8 | 4.3 |
| Ash | 0.7 | 0.9 | 0.8 | 0.8 |
| Total Solids | 12.5 | 17.5 | 16.83 | 12.8 |
| Total Moisture | 87.5 | 82.5 | 83.2 | 87.2 |
(Wong et al. 1988)
Milk Fat
Fat content ranges from 2.0 to 7.0 Kg/hl. An approximate average for regions where Holstein Friesian cattle predominate is about 3.9 Kg/hl. With respect to cheese manufacture and quality, the following properties are important:
- Milk fat is the most diverse of all natural fats. We routinely quantify over 50 fatty acids ranging from four carbons to 22 carbons in length. Many more have been identified.
- Traditional nutritional concerns that may or may not be justified are: (1) about 70% of milk fatty acids are saturated, and (2) milk fat contains cholesterol.
- Positive nutritional factors are butyric acid (anti-carcinogenic), saturated but mid to short length fatty acids (anti-hypertensive), and rumenic acid (anti-carcinogenic).
- The unique flavour of dairy fat is due to short chain fatty acids, especially butyric acid.
- The two major spoilage reactions in milk fat are: (1) break down of the triglyceride fat structure releasing fatty acids such as butyric to create a rancid flavour, and (2) oxidation of unsaturated fats creating an oxidized flavour (flat, cardboard flavour).
- The melting properties of butter fat are significant to cheese texture.
Milk Proteins
Total (crude) milk protein ranges from about 2.5 to 5.5 Kg/hl. The average for regions in which Holstein Friesians predominate is about 3.3 Kg/hl. There are two major groups of proteins, the caseins (about 2.6 Kg/hl), which are recovered in rennet coagulated cheeses, and the whey proteins (about 0.7 Kg/hl), which, for most types of cheese, are lost in the whey during cheese making. Caseins are not water soluble, so the cow packages them in water dispersible particles called micelles, which along with caseins include most of the milk calcium, magnesium, phosphate and citrate (more about casein micelles in Chapter 8). Unlike whey proteins, which are very sensitive to heat, caseins are affected little by heating except that they interact with heat denatured whey proteins. Table 9.2 lists the principal caseins and some properties which are most relevant to cheese making. Similarly, Table 9.3 lists some properties of the principal whey proteins.
Notice in the above paragraph the reference to crude protein. This term arises because protein is determined by measuring nitrogen in the milk and multiplying the amount of nitrogen by a coefficient to estimate protein content. However, about 4.5 – 6.0% of milk nitrogen is non-protein nitrogen (NPN), which is normally included with whey proteins (see Table 9.3). Correcting for NPN, that means true protein in Ontario herds averages about 3.15 Kg/hl and true whey protein is about 0.55 Kg/hl.
Table 9.2: The principal caseins and some properties of importance to cheese making
| Name | Symbol | % of Casein | Properties |
| Alpha-S1 casein | αS1 | 33 | -Binds calcium strongly -Sensitive to break down by rennet -Resists the natural milk protease, plasmin |
| Alpha-S2 casein | αS2 | 11 | -Binds calcium strongly |
| Beta-casein | β | 33 | -Partially soluble in cold milk -Broken down by plasmin but not rennet |
| Kappa-casein | κ | 11 | -Stabilizes casein particles against coagulation -Bonds with whey proteins during heating |
Table 9.3: The principal whey proteins and some properties of importance to cheese making
| Name | % of Whey Protein | Properties |
| Beta-lactoglobulin | 40 | -Readily reacts with κ-casein at temperatures greater than 65°C and interferes with rennet coagulation -Principal component of ricotta cheese |
| Alpha-lactalbumin | 15 | -Principal protein of breast milk -Used to prepare infant formula |
| Immunoglobulins | 6 | -Higher in colostrum |
| Other heat sensitive proteins | 4.0 | -Mainly includes bovine serum albumin |
| Heat stable proteins | 14 | -Cannot be recovered by heat-acid precipitation as in ricotta cheese manufacture |
| Non-protein nitrogen | 21 | -Consists of amino acids, ammonia, urea, and small peptides |
2. Factors Affecting Milk Composition
Species
(See also Table 9.1)
Cheese making principles are similar for milk of all species with some modifications required to account for high solids of some species such as buffalo and sheep. Cow milk and goat milk have similar cheese making properties except that:
- Goat milk cheese tends to ripen by lipolysis (fat breakdown) more than cow milk cheese.
- Goat milk has smaller fat globules, which allow higher fat recovery and possibly a smoother texture.
- Cow milk generally has better gelation properties than goat milk, at least partly because the milk of most goat breeds is low in αS1-casein. The practical effect is that goat milk is more suitable than cow milk for some varieties, such as Feta, but less suitable for other varieties such as Cheddar, which is strongly dependent on break down of αS1-casein by rennet for typical flavour development.
Genetics
Throughout the modern history of dairying, farmers have selectively bred dairy cattle to increase production or fat content or both. Recently, genetic selection has focused on other milk properties such as increasing the proportion of milk protein to fat. Three genetic effects are most relevant to cheese making.
(1) Relative Proportions of Fat and Protein (PF Ratio)
Fat content and protein content generally increase or decrease in parallel, but fat varies more with feed and season then protein. The same is true for breed (genetic) effects, such that higher fat breeds have lower protein/fat ratio. For example, a typical protein/fat ratio in Jersey milk is 0.7 relative to 0.84 in Holstein milk (Table 9.4).
Table 9.4: Typical fat and protein contents (Kg/100 Kg) for the milk of several breeds of dairy cows
| Breed | Fat | Protein | Protein/Fat Ratio |
| Jersey | 4.97 | 3.81 | 0.77 |
| Holstein | 3.85 | 3.20 | 0.83 |
| Guernsey | 4.64 | 3.44 | 0.74 |
| Brown Swiss | 4.16 | 3.50 | 0.84 |
| Canadienne | 4.29 | 3.56 | 0.83 |
| Milking Shorthorn | 3.82 | 3.30 | 0.86 |
| Ayrshire | 4.09 | 3.36 | 0.82 |
Data from the Canadian Dairy Information Centre for the years of 2009-2018.
Further, genetic selection has produced considerable within-breed improvement with respect to both milk production and increased protein and fat content. The result is greatly increased per cow production of milk protein and fat. However, because fat responds more to genetic selection than protein, the result at least in some areas has been a small but significant decrease in the average PF ratio. In Ontario, the PF ratio decreased from about 0.88 in 1970 to 0.85 in 1995[1]. A recent unpublished report (as of May 2020) of milk composition trends in Ontario suggests a further slight reduction in PF from 0.84 in 2001 to 0.83 in 2016 (Sneltjes, Hill and Corradini, 2019, Trends in Ontario Milk Composition from 1999 to 2017, Technical Report to Dairy Farmers of Ontario).
(2) Relative Proportions of Fat and Protein to Other Solids
With respect to other solids, mineral content (mainly Ca, Mg, and P) generally varies in proportion to protein content, and lactose content is relatively stable. So, because lactose is largely a wasted component, increasing protein and fat by feed or genetic selection has economic advantages in terms of feed conversion, milk transportation costs, and waste handling.
(3) Protein phenotypes
Heritable variations in caseins and whey proteins are associated with improved coagulation properties that result in increased cheese yield. These effects will be further considered in the chapter on cheese yield.
Stages of Lactation
Milk production increases and fat content decreases during the first 60 days of lactation. Thereafter, as production level gradually decreases fat and protein content increases, but again, fat content varies more than the protein content. The result is that the relative proportion of protein to fat (protein/fat ratio or PF) is highest at the peak of lactation (about 60 days of lactation) and lowest at the end of lactation. Protein distribution also changes during lactation with resulting effects on cheese ripening and flavour. In particular, the proportion of αs1-caseins decreases during lactation while the proportion of β-casein increases.
Feed
Depending on the relative demand for butter fat versus milk non-fat solids, there may be incentive to change the relative proportions of milk protein and fat. The only short term means to do this is by changing the diet. Generally, less roughage and more high energy feeds will encourage lower fat content with little decrease in protein content to provide a higher PF ratio. A major current interest is in grass fed milk. See Table 9.5.
Grass fed cows produce milk with higher CLA (conjugated linoleic acid) and a lower ratio of omega 6/omega 3 fatty acids, both of which are believed to promote health. The data in Table 9.5 includes only Ontario herds. Grass fed means: (1) grass fed as much as possible considering Ontario’s climate; and (2) High protein or high energy rations limited to amounts required to maintain adequate body weight of the milking cows. A detailed interim guide for Ontario grass fed herd feeding and management can be viewed at this link.
Table 9.5: Biomarkers for grass fed milk among Ontario herds. Herd samples gathered over a period of 12 months
| Feed Type | Observations | Mean CLA | Mean LA/ALA Ratio |
|---|---|---|---|
| % of total fatty acids | |||
| Grass + organic | 32 | 1.270 | 1.72 |
| Grass nonorganic | 106 | 0.92 | 2.52 |
| Organic | 298 | 0.720 | 3.17 |
| Conventional | 294 | 0.661 | 4.27 |
LA, linoleic acid, ω6
ALA, Alpha-linolenic acid, ω3
CLA, conjugated linoleic acid
Source: Corradini, Hill, Chao and Sneltjes, 2019. Technical report to the Dairy Farmers of Ontario.
Season
Seasonal variation in milk composition is important to cheese yield efficiency and composition control:
- Fat content reaches a minimum in August and a maximum in October – November (Figure 9.1).
- Protein content changes roughly in parallel with fat content, but the seasonal variations are smaller (Figure 9.1), causing slightly but importantly higher protein/fat ratios (PF) during the summer and lower PF ratios in the winter.
- Casein number (casein as a percentage of total protein) is relatively constant over the seasons; that is, casein varies seasonally but mostly in proportion to total protein. Having said that, there is a small positive association between total protein and casein number; that is, higher protein milk contains a higher proportion of casein. So, breeding or feeding for higher protein content has a double benefit for the cheese maker. We’ll further consider casein number in Chapter 16 on standardizing cheese milk.
3. Milk as a Growth Medium
Cheese making depends on the growth of bacteria to produce acidity, flavour compounds, and ripening enzymes. It is, therefore, important to understand the characteristics of milk as a growth medium.
General Nutrients
Milk is a good source of all principal nutrients, including carbon, nitrogen and macro-minerals. Many micronutrients such as vitamins and micro-minerals are also available. However, milk is unique with respect to its sugar.
Milk Sugar
Carbohydrates, especially simple sugars such as sucrose (table sugar), can be utilized as sources of energy more quickly than fats and proteins. However, the energy currency of the cell is glucose (also called dextrose). So, to use available carbohydrates for energy, microorganisms must be able to convert them to glucose.
The only sugar naturally present in milk is lactose. Most microorganisms lack the enzyme lactase, which is required to break lactose into its two component sugars, namely, glucose and galactose. Lactic acid bacteria, which do have lactase, readily break down lactose and use glucose as an energy source. Further, some lactic acid bacteria are able to convert galactose to glucose. Lactic acid bacteria, therefore, have a competitive advantage in milk; that is, they are able to outgrow bacteria that are unable to obtain glucose from lactose.
Acidity (pH)
Acidity, as measured by pH, is one of the most critical parameters with respect to both food safety and process and quality control of fermented foods such as cheese. The concepts of acidity and pH are explained in Chapter 7. The titratable acidity of milk typically varies from 0.12 to 0.25% lactic acid depending on composition, especially protein content. The pH of milk is near the physiological pH of 6.8, which, considering the following points, means that milk is a good growth medium with respect to acidity (pH). See Figure 9.3.
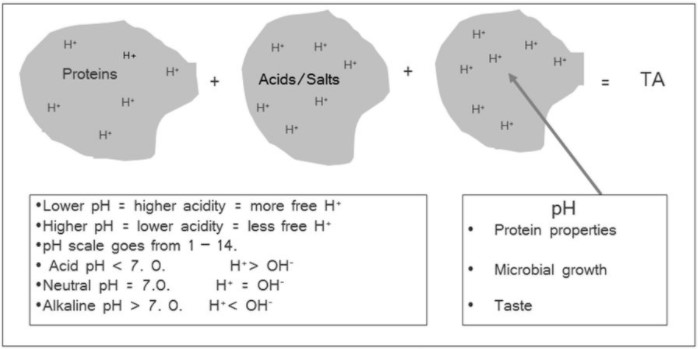
- Most organisms grow best near the physiological pH of 6.8. As explained before, titratable acidity (TA) is not a good predictor of acid effects on microbial growth and chemical properties such as protein functionality.
- The major groups of microorganisms important to food preservation are in order of increasing acid tolerance: bacteria, yeasts and molds.
- Natural fermentation of warm raw milk by lactic acid bacteria reduces milk pH to less than 5.0, which inhibits the growth of pathogenic bacteria and most spoilage bacteria. Note: some pathogenic bacteria such as Listeria monocytogenes and E. coli 0157: H7 are able to survive pH < 5.0 , but may not grow or grow very slowly.
The proteins and weak acids act as reservoirs for hydrogen (H+) and hydroxyl (OH–) ions. When acid is added, the equilibrium shifts to the left as free hydrogen ions associate more with proteins and weak acids. Conversely, when base (hydroxyl ions) is added as in determination of titratable acidity, hydrogen ions move out of the “reservoirs” to react with the hydroxyl ions. These, reservoirs, therefore, act as pH buffers, in that they reduce the effect of adding acid or base on the change in pH. In other words, titratable acidity (TA) measures all hydrogen ions, including those associated with proteins and acids, but pH measures only the activity of un-associated hydrogen ions, those that are free in solution.
Moisture
Milk has a high moisture content (typically 87% for cows’ milk) and with respect to available moisture, is an excellent growth medium. But, it must be understood that with respect to microbial growth, the critical parameter is water activity rather than moisture content. Water activity (aw) is an index of the availability of water for microbial growth. It is the availability of water in the food reported as a fraction of the availability of water from pure water. In other words, the aw of water is 1 and the aw of other substances is reported as decimal fractions of 1. Water activity is reduced by dissolved substances, varying directly with the number rather than the weight of dissolved molecules. For this reason, relative to large molecules such as proteins, small molecules such as sugar and salt have a large effect on water activity. For example, jams are preserved by their high sugar content.
Microorganisms vary greatly in their ability to survive and/or grow at reduced water activity. However, acknowledging that exceptions exist, the minimum water activity for growth of the principal groups of microorganisms are as follows:
- Most bacteria: 0.90 – 0.91
- Most yeast: 0.87 – 0.94
- Most molds: 0.70 – 0.80
Compare these values with typical aw values for milk, cheese and a few other foods:
- Milk, fresh fruits and vegetables, fresh meats 60 – 98% moisture, aw 0.97 – 1.00
- Most baked products, some cheese, some cured meats, 20-60% moisture, aw 0.88 – 0.96.
- Dehydrated foods such as breakfast cereals. Less than 5% moisture, aw 0.20 – 0.30
Typical aw values for some cheese at the marketing stage are given below [2]. See also the typical aw values for cheese families in Table 3.1. Note that the aw of ripened cheese decreases with age because the ripening process reduces large molecules such as proteins to smaller proteins or peptides.
- Brie 0.980
- Munster 0.977
- Saint-Paulin 0.968
- Edam 0.960 (young)
- Cheddar 0.950 (young)
- Cheddar 0.85 (old)
- Parmesan 0.7 – 0.8 (ripened)
Availability of Oxygen
With respect to oxygen requirements, microorganisms may be:
- Aerobic: must have oxygen to grow.
- Anaerobic: can only grow in the absence of oxygen.
- Microaerophilic: require small amounts of oxygen.
- Facultative anaerobes: able to grow with or without oxygen.
Molds require oxygen, so they can be eliminated by vacuum or gas flush packaging. Most yeast are aerobic (require oxygen), but some can grow anaerobically (in the absence of oxygen). Bacteria may fall into any of these categories, but lactic acid bacteria are microaerophilic or facultative anaerobes.
Milk will acquire some dissolved oxygen during milking, storage and handling, but it is used up quickly by bacterial growth.
4. Types of Microorganisms and Their Activities in Milk
The numbered list below identifies seven types of bacteria according to how they change the properties of milk. Often, these changes are negative (spoilage), but, as we will see in later sections, many of these bacteria are important to the development of cheese flavour. Before proceeding to the list, please note the following definitions:
- Psychrotrophic refers to microorganisms that are able to grow at temperatures less than 7ºC. Cold milk storage and transport selects for psychrotrophic bacteria which are often proteolytic and lipolytic. Common psychrotrophic bacteria in milk are species of Micrococci, Bacilli, Staphyloccoci, Lactobacilli, Pseudomonas, and coliforms. Pseudomonas species are the most common and typically have the most impact on quality. At temperatures of 2 – 4ºC, bacterial growth in milk is mainly due to strains of Pseudomonas flourescens. Little growth occurs at temperature less than 2ºC.
- Spore forming bacteria are able to exist in a highly stable form called “spores”. In the spore state, these bacteria are able to withstand greater extremes of acidity, temperature and desiccation.
- Enzymes are biological catalysts that accelerate the rates of biochemical reactions. Bacterial enzymes are most significant to milk spoilage and cheese ripening, but it is important to distinguish between an enzyme and its bacterial source. For example, many psychrotrophic bacteria produce heat stable enzymes that remain active after the bacteria are killed by pasteurization.
Keeping the above definitions in mind, note the following types of microorganisms, grouped according to their impact on milk quality.
1. Lactic acid bacteria (LAB) ferment lactose to lactic acid and other end products. Lactic acid bacteria important to cheese making will be described further in Part 12. Also, our cheese certificate program includes an online course devoted to dairy fermentations. For now note:
- LAB are able to readily metabolize lactose, so they have some competitive advantage over other microorganisms.
- Notwithstanding, their ability to metabolize lactose, LAB prefer temperatures greater than 30ºC, so, depending on initial relative counts, psychrotrophic bacteria including some coliform and pseudomonas bacteria are able to outgrow LAB at room temperature or lower.
2. Proteolytic bacteria degrade protein and cause bitterness and putrefaction. Most important in cheese milk are species of:
- Pseudomonas, which are psychrotrophic and produce heat stable lipases and proteases.
- Bacillus, which form heat stable spores and survive pasteurization.
3. Lipolytic bacteria that degrade fats and produce lipolytic rancidity. Again, the most common example in milk is the genus Pseudomonas. Several psychrotrophic species of Pseudomonas produce heat stable lipases as well as proteases.
4. Gas producing microorganisms that cause cheese openness, floating curd in cottage cheese, and gassy milk.
- Yeasts are always present in milk and are common contaminants during the cheese making process. They may cause “yeast slits” in cheese and contribute to ripening of surface ripened cheese.
- Coliform bacteria are always present in milk, but their numbers can be minimized by good sanitation. Also, coliform bacteria compete poorly with lactic acid bacteria, so their numbers decrease in the presence of a growing lactic acid culture.
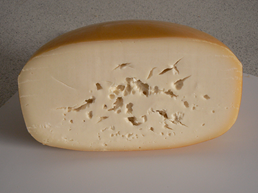
- Clostridium tyrobutyricum is a thermoduric (survives pasteurization) spore forming organism of legendary fame among cheese makers. C. tyrobutyricum causes gas formation (carbon dioxide) during the later stages of ripening of Swiss and Dutch type cheeses. The resulting craters and cracks in the cheese are called “late gas defect”. European cheese makers frequently check raw milk for thermoduric and/or spore forming bacteria. Five hundred spores per litre of milk are sufficient to cause late gas defect.
- Propionibacterium produces the desirable gas formation in Swiss type cheese.
- Some lactic cultures, called heterofermentative, also produce carbon dioxide. See Part 12.
5. Ropy bacteria cause stringy milk due to excretion of gummy polysaccharides. Usually ropy bacteria such as Alcaligenes viscolactis are undesirable. However, in some fermented dairy products, ropy lactic acid bacteria such as certain subspecies of Lactococcus lactis are used to develop texture.
6. Sweet curdling bacteria produce rennet-like enzymes which may coagulate milk. Common examples are the psychrotrophic spore formers Bacillus subtilis and Bacillus cereus.
7. Numerous off flavours have been associated with specific milk contaminants. Some examples are:
- Malty: L. lactis var maltigenes
- Bitter: Proteolytic bacteria
- Rancid: Lipolytic bacteria
- Unclean: Coliform bacteria
- Fishy: Pseudomonas
- Fruity: Pseudomonas
Pathogenic Bacteria
A comprehensive treatment of cheese safety and preventative control programs is beyond the scope of this course. However, Part 21 is an an introduction to cheese risk analysis (especially cheese risk assessment) and Part 22 covers the basics of cheese plant sanitation. Also, included in the Cheese Maker Certificate program is a more comprehensive course on cheese safety called Cheese Safety and Quality Assurance. Here, we briefly describe a few pathogens which are particularly significant to cheese making. We begin with definitions to distinguish between food infection and food intoxication.
Food infections are caused by organisms that grow in the gastrointestinal tract. Illness occurs after the ingestion of an infectious dose, which depends on many factors including the health status of the person.
Food intoxication results from toxins produced by bacteria. Toxins may be present within the bacteria (endotoxin) or excreted outside the bacteria (exotoxin). The organism need not be alive or even present to cause illness. A good example, is Staphylococcus aureus. Like all the other pathogenic bacteria listed below, Staphylococcus aureus is destroyed by pasteurization but its exotoxin survives pasteurization.
Pathogens: Common Before 1940
- Corynebacterium diptheriae: causes diphtheria.
- Brucella abortus: causes brucellosis in cows and undulant fever in people.
- Mycobacterium tuberculosis: causes TB in people.
- Coxiella burneti: causes Q fever in people.
Pathogens which Emerged During 1940 – 1970
- Staphylococcus aureus: food intoxication caused by heat stable enterotoxins of which enterotoxin A is the most common.
- Salmonella species: Salmonellosis is an infection caused by many species and strains of Salmonella. Salmonellosis is of great concern to the dairy industry, especially the cheese and milk powder sectors. Infectious doses can be extremely low, perhaps as low as a single organism.
- Enteropathogenic E. coli bacteria produce enterotoxins, some of which are heat stable. Of numerous species and strains, the most famous is E. coli 0157: H7, which occurs frequently in raw milk. E. coli 0157: H7 is of particular concern because it is quite acid tolerant and is able to grow (slowly) at refrigeration temperatures.
Pathogens emerging after 1970
- Yersina enterocolitica is a psychrotrophic infectious agent.
- Campylobacter jejuni, is an infectious agent which has passed Salmonella as the global leading cause of diarrhea.
- Listeria monocytogenes is a psychrotrophic infectious agent that requires special caution because it is acid tolerant and more heat stable than most pathogens, although it does not survive proper pasteurization. Also, its widespread distribution and persistence in plant environments has earned Listeria monocytogenes respect as an indicator of sanitation. Its general persistence on ready to eat foods led Health Canada to implement a revised Listeria policy effective April 1, 2011, which basically specifies zero tolerance for the presence of Listeria monocytogenes in ready-to-eat foods, such as cheese and sliced meat, which support the growth of Listeria [3]
- Bacillus cereus is mainly important as a spoilage agent. However, some strains are mildly pathogenic. This is problematic because Bacillus cereus forms heat stable spores which survive pasteurization and are able to grow at refrigeration temperatures.
5. Mastitic Milk and Antibiotics
Mastitis is an infection of the udder which negatively impacts milk quality. Pooling milk dilutes the effect of single infected cows and herds but in most jurisdictions, the cumulative effect of mastitis, especially sub-clinical mastitis, is significant. Olson [4] estimate a cheese yield loss of 1% if 10% of the milk is from cows with sub-clinical mastitis. Further, as noted below, the quality effects of mastitic milk are probably of more economic importance than the yield effects.
Causative organisms include human pathogens such as E. coli and Staphylococcus aureus. Nonbacterial infections such as prototheca infection also cause high somatic cell counts (SCC). Ontario producer milk data suggests that prototheca is a common mastitic agent and frequently contributes to high SCC and bacterial counts.
Lactic cultures are very sensitive to antibiotics. In most jurisdictions, increasing penalties have greatly reduced antibiotic residues in milk. Nevertheless, antibiotic testing of all cheese milk is still recommended. See rapid screening tests in Part 5.
Typical Ranges of Somatic Cells
Somatic cells include any type of “body” cell in the milk, such as skin cells (epithelial) from the cows’ udders and leukocytes of several types. Leukocytes are white blood cells which are part of the cows’ immune response to infection in the udder. So they are used as an index of mastitis or udder infection. Several observations are relevant:
- The milk of healthy cows should contain less than 100,000 somatic cells per ml of milk. Higher counts indicate subclinical mastitis (infection in the udder).
- Clinical mastitis is associated with counts greater than 1,000,0000/ml.
- Producer milks in Ontario average about 200,000 cells/ml but counts less than 100,000 can be achieved with good herd management.
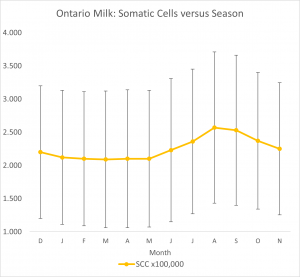
- SCC in Ontario herds increase during June, July and August and then decrease during Sept through November. See Figure 14.4.
Critical Ranges with Respect to Milk Quality
There is evidence that counts as low as 100,000 cells/ml affect cheese yield[5] and the quality of other dairy products such as ultra-high temperature milk. SCC in the range of 250,000 ‑ 500,000 are associated with altered milk composition and decreased cheese yield. When counts exceed 1,000,000 cells/ml, altered milk composition and reduced cheese yield, are obvious.
Composition Effects
Gross composition effects of udder infection are not significant for SCC less than about 250,000 cells/ml.
Above that level the following trends are observed:
- Little change in fat content
- Increased mineral content, particularly more chloride.
- Decreased lactose content which balances the osmotic effects of increased mineral content.
- Protein effects:
- Less casein
- More whey proteins, especially immunoglobulins
- More non-protein nitrogen
- Increased pH (up to 7.5 whereas 6.7 is normal)
Bacteriological Properties
High SCC are normally associated with the shedding of pathogenic (to humans) bacteria in the milk including E. coli, S. aureus and others. Basically, whatever organism is causing the udder infection, including the algae, prototheca, will be present in the milk. Further, growth factors present in high SCC milk encourage growth of both E. coli and S. aureus [6]. The growth rates of some lactic cultures are also affected; Streptococcus thermophilus grows faster and Lactobacillus acidophilus is inhibited.
Significance to Cheese Milk
Cheese yield is affected in several ways:
- Mastitic milk contains more plasmin, a heat stable milk protease which degrades protein and causes more protein to be lost in the whey.
- Reduced casein directly reduces cheese yield.
- Poor curd formation (longer flocculation time, slower rate of curd firming, and reduced maximum firmness) contributes to yield loss as fines.
Perhaps more important than yield are the effects of sub-clinical mastitis on cheese quality [7]. Modest levels of SCC cause several quality problems:
- Decreased curd strength due to high whey proteins, low caseins, high pH, and altered calcium‑phosphate‑caseinate balance.
- Higher moisture cheese due to impaired curd syneresis.
- Soft, less elastic, sticky and grainy cheese texture.
- Increased flavour intensity, usually with off flavours
Significance to Fluid Milk
Very high counts (> 2 million) will cause milk to taste salty and result in many quality problems. Lower counts, even as low as 300,000 can increase development of bitter flavour due to increased levels of plasmin. This is a particular problem with ultra-high-temperature processed milk because the enzyme is heat stable and the storage time is long enough to permit significant protein degradation.
6. Raw Milk Quality Tests
The following list is a summary of the most important raw milk quality tests. Procedures for some milk quality tests are described in Part II.
- Organoleptic or sensory for raw milk is limited to appearance (e.g. visible dirt, or churned fat) and odors. In many jurisdictions milk receivers must complete a course and be certified as a milk and cream grader. In Ontario milk receivers require a Plant Milk and Cream Grader certificate, which is administered by the Ontario Dairy Council.
- Total plate counts: good < 3,000 cfu/ml; Ontario penalty level > 50,000 cfu/ml OR 121,000 IBC. Note: cfu is colony forming units. IBC is individual bacteria count.
- Coliforms: good < 10/ml; concern > 25; max 100
- Psychrotrophic bacteria (grow at T < 7ºC): good < 1,000
- Somatic cell counts: good < 100,000; concern > 300,000; Ontario penalty level >400,000
- Rapid test for inhibitors
- Added water: Ontario penalty level is freezing point greater than -0.505ºC
- Composition: fat, protein, lactose, total solids, and casein if possible
- estimated from data provided by Laboratory Services Division, University of Guelph ↵
- (Eck and Gillis, 2000) ↵
- http://www.hc-sc.gc.ca/fn-an/legislation/pol/policy_listeria_monocytogenes_2011-eng.php (accessed 27 Oct 2020). ↵
- Eck and Gillis (2000) ↵
- Barbano et al., 1991, J. Dairy Sci. 74:369 ↵
- (Amer. J. Vet. Res. 45:2504) ↵
- (J. Dairy Res. 53:645) ↵
Can break down proteins.
Can break down fats.
Count of the number of somatic cells in a fluid. SCC will increase with presence of pathogenic bacteria.
Small curd particles that are not recovered in the cheese.
