Cardiac Action Potentials
Ever wonder how your heart beats? Or why it beats faster during stressful situations? This is all thanks to cardiac action potentials! The different cardiac action potentials work together to generate a steady heartbeat. The electrical system sends an impulse along the conduction pathway to the ventricle, where the contractile system initiates contraction and pumps blood out into the body. Different inputs can speed up or slow down these systems and impact our heart rate.
Learning Outcomes
In this section you will learn…
- The function of nodal cells in the electrical system of the heart, specifically focusing on the role of pacemaker cells.
- The role of atrial myocytes and ventricular myocytes in the contractile system of the heart.
- The different types of action potentials and understand how they work together to generate constant conduction for contraction of the heart and the cardiac cycle.
Nodal Cell Action Potential – Electrical System
You have likely studied the action potential profiles of neurons in your previous Human Physiology classes. Studying the action potential profiles help us understand how neural impulses are propagated along a circuit and result in events such as skeletal muscle contractions. In this section, we will investigate the different cell types found in the heart and how these cells differ in their action potential profiles and resulting functions. The first type of cell found within the heart are referred to as nodal cells, which comprise the electrical system. Nodal cells are excitable tissue that undergoes depolarization, which facilitates the subsequent contraction of the heart.
Nodal Cell Action Potential Profile
This diagram illustrates the action potential profile of a nodal cell within the heart, with time plotted against membrane potential. From this diagram, several characteristics of a nodal cell can be noted. For example, there are three distinct stages of the action potential: pre-potential, de-polarization, and re-polarization. In the pre-potential stage, the charge of the membrane is seen to slowly become more positive. This is due to the spontaneous depolarizing characteristic of nodal cells, which is explained later in this subchapter. During this pre-potential stage, there is a slow influx of sodium (Na+) ions into the cell, causing the membrane potential to go from around −60 millivolt (mV) to −40mV. The next phase is de-polarization, characterized by a rapid influx of calcium ions into the cell that causes a sharp spike in membrane potential reaching about +20mV. Finally, re-polarization is the third and final phase in which potassium (K+) ions are removed from the cell, and the membrane potential returns to that starting point of −60mV. The rate of nodal cell firing will depend on the location of these cells in the heart due to the orderly control of electrical activity.
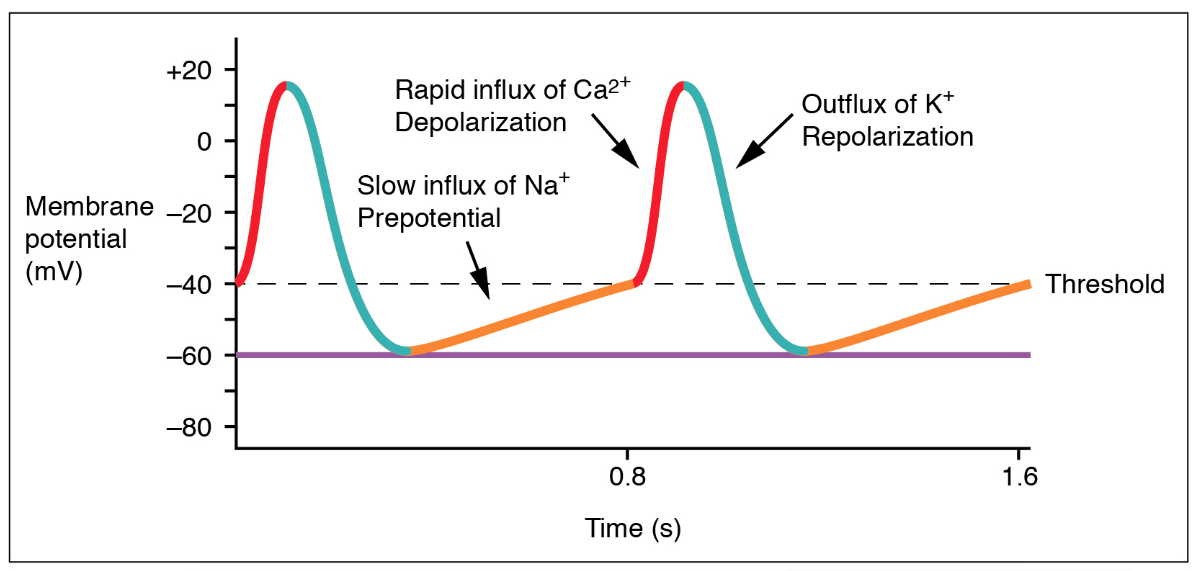
As shown in figure 1, the pre-potential (yellow phase) occurs due to a slow influx of sodium ions until the threshold is reached, followed by a rapid depolarization (red phase) and re-polarization (blue phase) of the cell. The pre-potential accounts for the membrane reaching threshold and initiates the spontaneous depolarization and contraction of the cell. Note the lack of resting membrane potential.
Tips From Past Students
It may be useful to review your HK*2810 class notes from the first unit (Communication – Principles). Cardiac action potentials follow the same general patterns as skeletal muscle action potentials but are slightly more complex. It may seem repetitive but you may find reviewing the basic definitions of de-polarization and re-polarization very helpful.
Spontaneous Depolarizer
A spontaneous depolarizer automatically depolarizes to reach threshold without an external stimulus as they do not have a stable membrane potential. Sodium slowly flows into these cells through sodium leak channels making the inside of the cell more positive until threshold is reached and the depolarization phase can begin. The sinoatrial node (SA node) is the spontaneous depolarizer that sets the rhythm of the heart and is often called the pacemaker. In the above diagram, you can see the cell slowly depolarize from −60mV to −40mV through spontaneous depolarization.
Test Your Knowledge
Clinical Application:
CLEAR! Automated External Defibrillators (AEDs) are common medical devices that you have likely seen hanging on a wall in your lab or classroom. These devices are used as a stimulus to cause the heart to contract when someone is experiencing cardiac arrest. Using your knowledge of cardiac action potentials, explain how this is possible. Hint: The relative refractory period is called “relative” because another action potential can be generated if the stimulus is greater than the original.
Nodal Cell Action Potential Wave Video
This video summarizes the information covered thus far in the subchapter, explaining the process of the nodal cell action potential and how this provides the shape of the profile. The beginning of the video (until 2:15) will focus on the concept of pacemaker cells, otherwise known as nodal cells. The video emphasizes that these cells are spontaneous depolarizers, and therefore, are important for starting a contraction. The video then goes on to describe important terms such as “automaticity“, and “threshold“.
Autonomic Nervous System Impact on Nodal Cell and Heart Rate – Chronotropic Effects
Several factors can influence the firing rate of nodal cells. A key influential factor in these cells’ firing rate is the innervation of the Autonomic Nervous System branches, the Sympathetic Nervous System (SNS), and Parasympathetic Nervous System (PNS). The innervation of these systems allows them to alter the firing rate of nodal cells and therefore alter heart rate. Stimulation of the SNS will increase the firing rate and heart rate, while PNS stimulation will decrease the firing rate and heart rate. The mechanisms of these opposing systems are as follows;
SNS will increase the permeability of nodal cells to sodium (Na+), increasing the Na+ leak rate during the pre-potential phase. This results in the membrane potential reaching threshold and initiates depolarization at a quicker rate. The faster depolarization causes an increase in firing rate, which translates to an increase in heart rate.
PNS will open the ligand-gated potassium (K+) channels allowing the positive K+ ions from within the cell to flow out. This makes the inside of the cell more negative, bringing the membrane potential further away from threshold. The effect of making the membrane potential more negative and further away from threshold is known as hyperpolarization. The leak rate of Na+ is unchanged, however, it will take a longer period of time to accumulate enough Na+ to bring the membrane to threshold and spark an action potential. This results in a decrease in firing rate and therefore a decrease in heart rate.
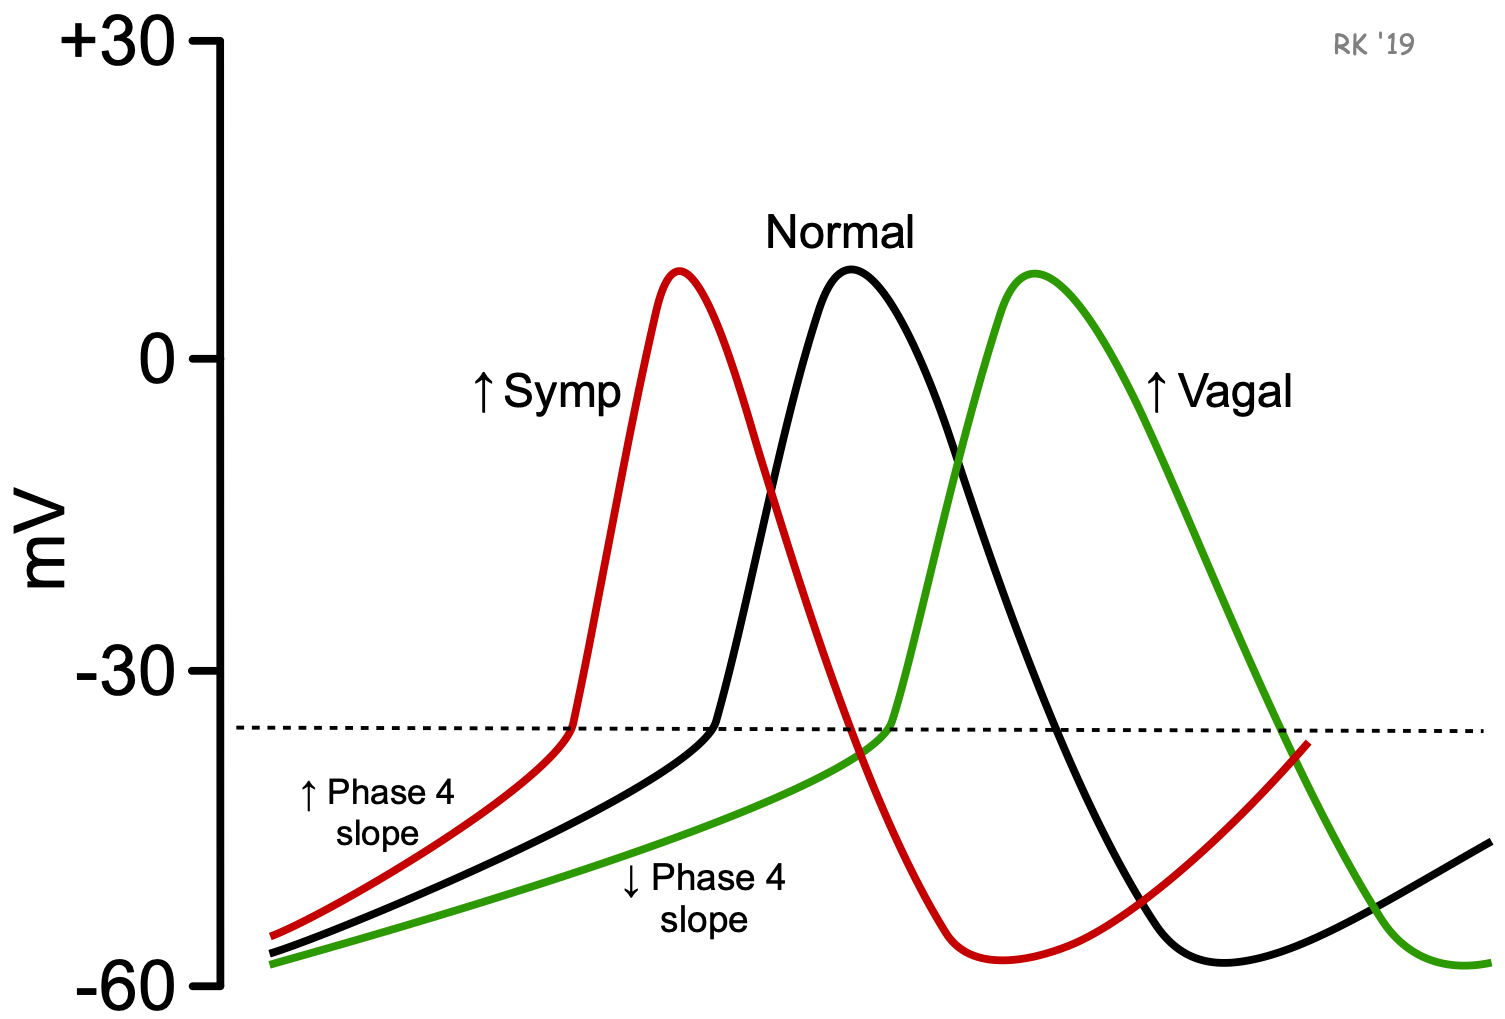
The following diagram illustrates the alteration made to the nodal cell action potential profile as a result of SNS or PNS stimulation. (PNS stimulation is represented through an increase in vagal stimulation).
Summary of the Chronotropic Effect on Heart Rate:
Increasing HR (red line):
- Increase spontaneous depolarization by increasing Na+ flux into the nodal cells for faster depolarization.
- Controlled by SNS innervation.
- SNS → release NE (Norepinephrine) → Increase nodal cells permeability to Na+ → Increase Na+ leak rate → depolarize and reach threshold faster → Increase HR.
Decreasing HR (green line):
- Decrease heart rate by increasing K+ flux out of cell for faster hyperpolarization.
- Controlled by PNS innervation.
- PNS → Ach (Acetylcholine) → Open Ach ligand potassium channels → Hyperpolarization → Decrease HR.
Test Your Knowledge
Real-Life Scenario:
You’re running to get to Creelman before the lunch rush begins. As a result, your body releases NE. What effect will the release of NE have on the rate of depolarization? What effect will it have on heart rate? Hint: Sketch the change in the action potential frequency to better understand its effect.
Cardiac Myocyte Action Potential – Contractile System
Cardiac Myocyte Action Potential Profile
The second type of cell found in the heart are called cardiac myocytes, and they comprise the contractile system. The cardiac myocytes are responsible for the orderly contraction of the heart to eject blood out and into circulation. The contraction of these cells follows the electrical activity of the nodal cells; therefore, these cell types work together to ensure the efficiency of the heart. There are several distinctions between cardiac myocytes and nodal cells as they serve very different functions. For example, cardiac myocytes do not contain leaky Na+ channels and therefore are not spontaneous depolarizers. Another difference lies in the cardiac myocyte permeability to K+ as the ions do not enter the cells due to ligand-gated channels. The movement of K+ ions out of the cell is a result of concentration and electrical gradients.
The following diagram presents an illustration of the action potential profile of a cardiac myocyte. Similar to nodal cells, there are three distinct phases. These phases are; rapid depolarization, plateau, and re-polarization. Rapid depolarization occurs following the electrical activity of nodal cells that cause the membrane to reach potential and the opening of voltage-gated Na+ channels. Na+ ions rush into the cell, causing a rapid increase in membrane potential to around +30mV, where the channels become inactive. This signals the plateau phase where voltage-gated Ca2+ (calcium) channels open, allowing the slow influx of trigger Ca2+ into the cell (recall, Ca2+ promotes the actin-myosin interaction and cross-bridge formation required for contraction). The end of the plateau phase occurs when these slow Ca2+ channels become inactive. Throughout the process, K+ ions flow out of the cells as the inside is becoming increasingly positive due to the influx of Na+ and Ca2+ , causing K+ to move down its concentration. The re-polarization phase includes the continued flux of K+ out of the cell, while Ca2+ and Na+ are no longer fluxing into the cell. This movement imbalance results in the cell becoming more negative and causes the membrane potential to return to the original charge of −90mV. Finally, the end of the re-polarization phase is marked by the closing of these K+ channels.
This diagram was included because it is helpful to visualize the flux of ions in and out of a cell as it’s related to membrane potential. The diagram relates action potential stages to refractory periods and compares skeletal muscle action potentials to cardiac muscle action potentials.
When looking at the diagram there are a few concepts to take note of. The long plateau phase is due to the influx of calcium ions. The extended refractory period allows the cell to fully contract before another electrical event can occur. The “absolute” purple arrow in the cardiac muscle action potential should be labeled as the “effective” refractory period.
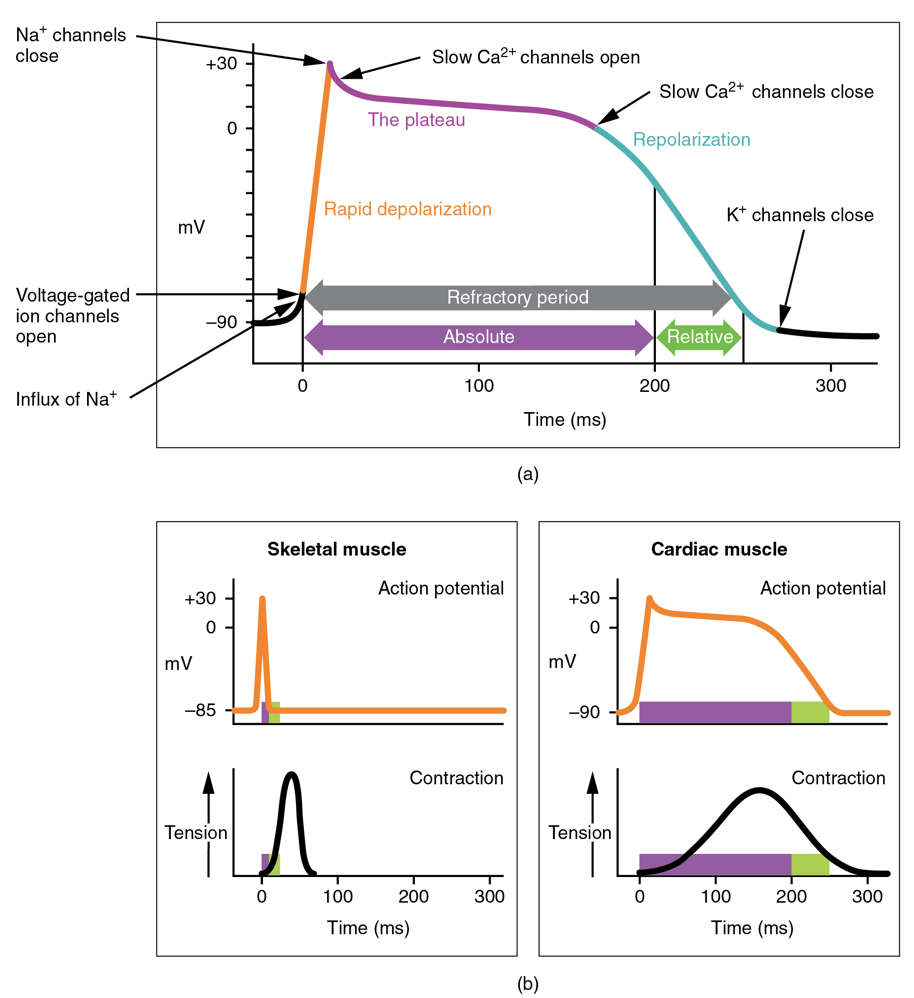
Absolute/Effective Refractory Period:
The period in which another action potential cannot be generated even if another stimulus is applied. The Na+ channels are in the inactive state and cannot be opened even if threshold is reached.
Relative Refractory Period:
The period during which increased stimulation can generate another action potential. The K+ channels are open (causing hyper-polarization), but the Na+ channels are in the closed state and can be opened if the threshold is reached.
Clinical Application:
Demand pacemakers are a type of artificial cardiac pacemaker that monitors the heart’s rhythm. If the heart skips a beat or if the speed of contraction is too slow to sufficiently pump blood, it will send an electrical signal to the bottom of the right ventricle. Explain how the implanted pacemaker could help the heart contract normally once again. How does the location of the implanted pacemaker differ from the SA node? The AV node? [1] Hint: For more information about artificial cardiac pacemakers, visit this webpage. (New Tab)
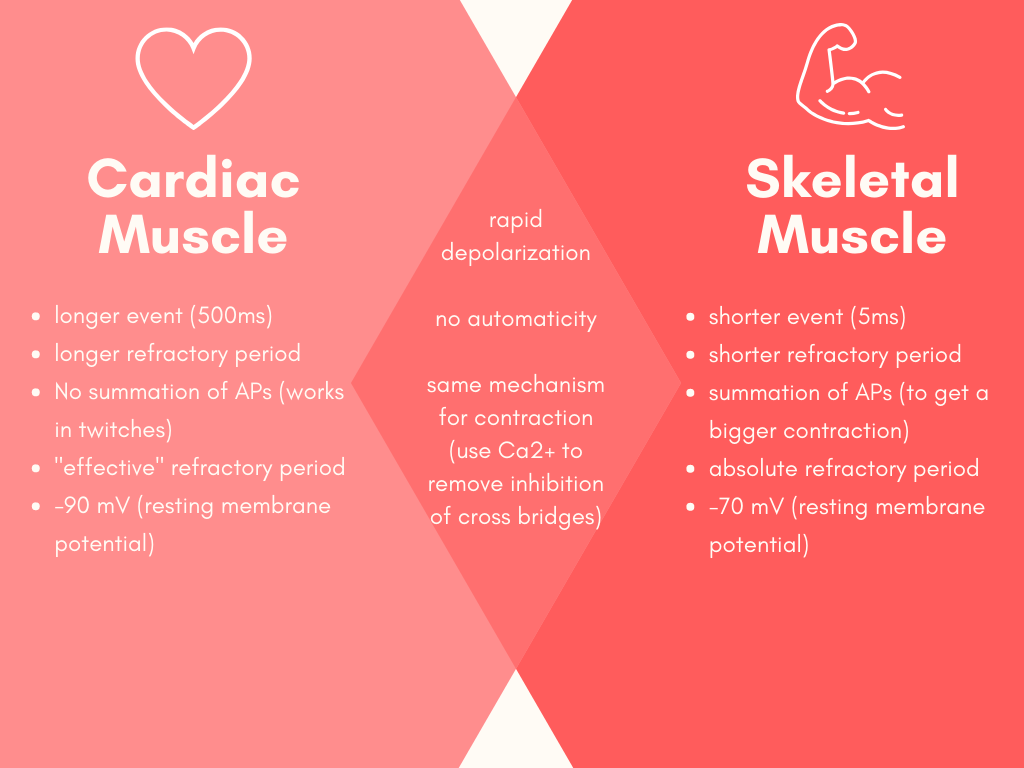
Cardiac Muscle vs. Skeletal Muscle
Now that we have discussed the unique cell types of the heart, we can compare the properties of the contractile cardiac myocytes to the contractile skeletal muscle cells you have likely learned about in past Human Physiology courses. The following diagram is beneficial to use as it clearly labels the differences between cardiac muscle and skeletal muscle action potentials. Additionally, several similarities are displayed in the middle.
Cardiac Myocyte Action Potential Wave Video
This video was included because it explains the previous learning object in more detail and provides more context regarding cardiac myocytes to improve your understanding. The video highlights the differences between Purkinje and nodal cells and describes several important terms. “Automaticity” is described at 1:25, “Conduction” at 6:25, and “Contraction” at 11:08. The video provides interesting context and lots of clinical application examples. Not all of the information is necessary to know so you may benefit from skipping ahead to one of the above definitions if you find yourself struggling. Please note that this learning object is slightly above the level of knowledge required for HK*3810 because it has clinical applications and talks about the vagus nerve.
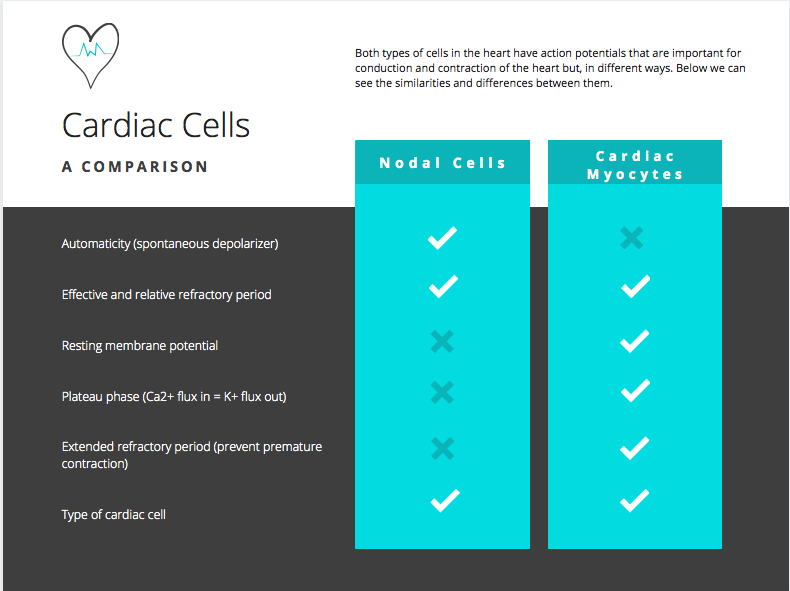
Summary: Cardiac Cells Comparison
Before we move onto another topic, let’s ensure that you fully understand the differences and similarities between the cardiac cell types. The following graphic compares the characteristics of cell types providing a beneficial learning object to refer to if you are ever in need of a refresher. In the next part of the subchapter, we will apply our knowledge of these cardiac cells to the heart’s electrical conductance and physical contraction in the cardiac cycle.
Test Your Knowledge
Thinking Beyond:
At this point, we have seen three action potential diagrams: neurons, nodal cells, and cardiac myocytes. How do these three action potential profiles differ in shape, refractory periods, and types of ion channels involved? To help you, try making a chart that compares the three cell types and their characteristics. What would happen if the AP seen in neurons occurred in the heart instead? Hint: Consider the speed of the event and how they are initiated.
Conductance and Contraction of the Heart – The Cardiac Cycle
Pathway of Conductance in the Heart
Now that we have covered heart anatomy in the first subchapter and covered the electrical and contractile cells in the first half of the present subchapter, we can apply these concepts to gain a more in-depth understanding of the cardiac cycle. The following diagram provides a simplified illustration of the pathway of electrical conductance in the heart. Note that the purple wave in the diagram depicts the movement of electrical activity.
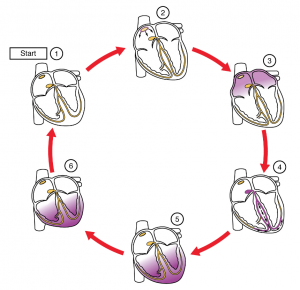
Summary of the diagram:
- The SA node and the remainder of the conduction system are at rest.
- The SA node initiates the action potential, which sweeps across the atria.
- After reaching the AV node, there is a delay of approximately 100 milliseconds (ms) that allows the atria to complete pumping blood before the impulse is transmitted to the atrioventricular bundle.
- Following the delay, the impulse travels through the atrioventricular bundle and bundle branches to the Purkinje fibres, and also reaches the right papillary muscle via the moderator band.
- The impulse spreads to the contractile fibres of the ventricle.
- Ventricular contraction begins.
Test Your Knowledge
Clinical Application:
Wolff Parkinson White syndrome (WPW) is a congenital heart disorder caused by an electrical disturbance. During pregnancy, an accessory pathway is created between the atrium and the ventricle in the fetus. While the electrical stimulus typically passes through the AV node, this accessory pathway provides a quicker route. Using our knowledge of the Pathway of Conductance, how will WPW syndrome affect heart rate?[2] Hint: Recall the conduction velocities associated with the structures of the heart when undergoing depolarization. Relate this electrical conduction velocity to heart rate (HR).
Learn more about WPW syndrome and its impact on the heart by reading this article. (New Tab).
Conduction Velocity and Pacemaker Rate
As discussed above, the conductance of electrical activity in the nodal cells of the heart occurs in a pre-determined order. This ensures that the contraction following the depolarization is efficient to push blood throughout the chambers of the heart and into circulation. The nodal cells’ location in the heart will determine their spot in the order, their conduction velocity, and their pacemaker rate. Under normal cardiac conditions, the SA node is the first to depolarize, demonstrating a conduction velocity of 0.05 minutes/second (m/s) and a pacemaker rate of 70-80 beats/minute (beats/min). Since the SA node is the first to depolarize, it is referred to as the pacemaker cell. Note that this learning object is above the level of knowledge required for HK*3810, since specific numbers are not necessary to know.
| Normal Activation Sequence | Structure | Conduction Velocity (m/s) | Pacemaker Rate (beats/min) |
|---|---|---|---|
| 1 | Sinoatrial node (SA node) | 0.05 | 70-80 |
| 2 | Atria (Atrial muscle) | 1.0 | none |
| 3 | Atrioventricular node (AV node) | 0.05 | 40-60 |
| 4 | Bundle of His | 1.0 | 15-40 |
| 5 | Purkinje fibers | 4.0 | 15-40 |
| 6 | Ventricular muscle | 1.0 | none |
The different pacemaker cells do not compete, and they go at the pace of the fastest rate (SA node). Therefore, if there is an issue with one structure in the sequence, the conduction rate will move to the next fastest pacemaker rate. This is why the differences in conduction velocity and pacemaker rate can be used as a diagnostic tool to see which pacemaker cell is not working properly in the heart. An artificial cardiac pacemaker is a common medical device that serves the same purpose as a pacemaker nodal cell. It sends an electrical impulse telling the heart when to beat.
Contraction Pattern Cardiac Cycle Diagram
This diagram was included because it integrates our knowledge on cardiac myocyte action potentials and heart contractions with what we will be learning in the next section about the pressure-volume relationship of the cardiac cycle.
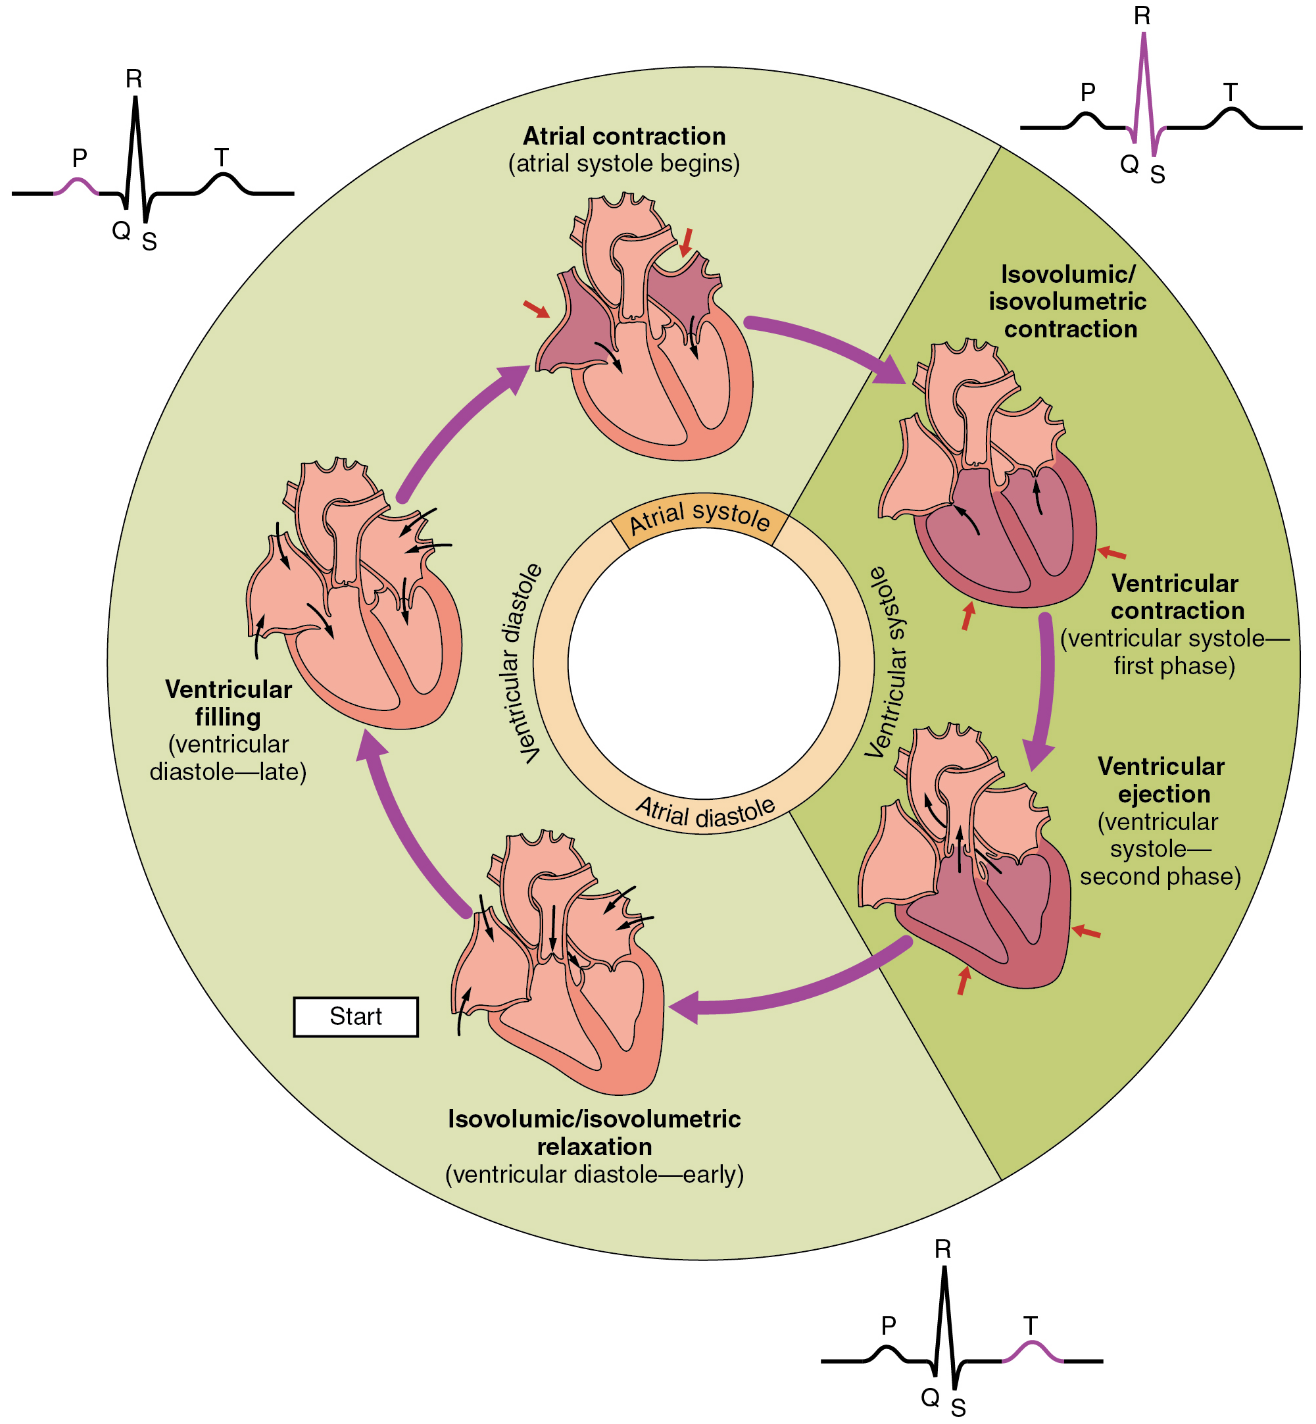
To Summarize…
The cardiac cycle begins in diastole, where the heart is relaxed and the right atria is being passively filled with blood. Next, we see atrial systole in which both atria contract in order to push blood into circulation within the heart. Next, in ventricular systole, we see the blood reach the ventricles before being ejected out of the heart and into circulation of the body. One round of this contraction and circulation is equal to one cardiac cycle.
Tips From Past Students
Introducing the cardiac cycle now may seem a bit intimidating, but thinking about it in terms of conduction and contraction now will save you time memorizing things down the road because the steps will become more intuitive.
Cardiac Cycle Video
Here is a video representation of the cycle depicted in figure 7. Watch as the narrator explains the pathway of blood through the heart with respect to the pressure-volume relationship. The video will also introduce all relevant cardiac output equations (at 10:00) and presents stroke volume, which will also be helpful for next chapter. Please note that this learning object is slightly above the level of knowledge required for HK*3810.
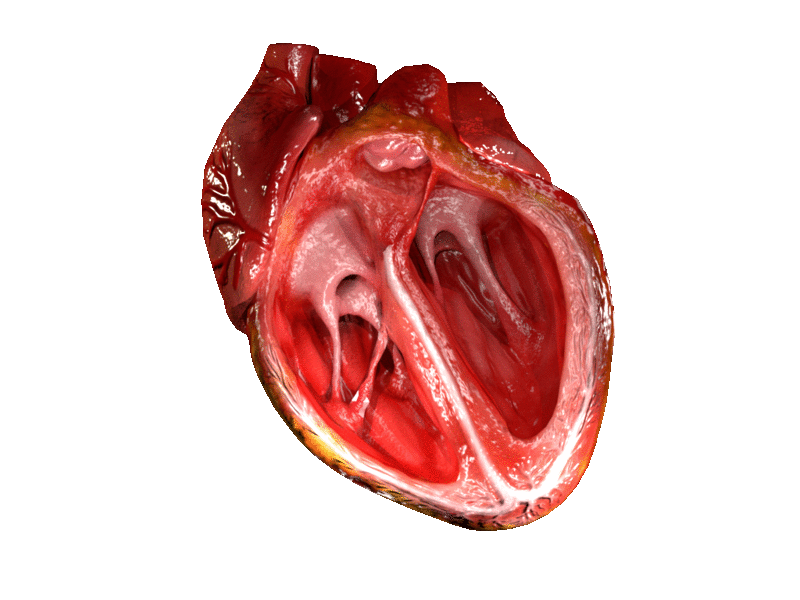
Visualizing Contraction – Putting it All Together
This GIF is a fun addition to provide you a moving representation to visualize how the electrical and contractile systems work together to promote the orderly contraction of the heart. Thinking of the molecular mechanisms behind the contraction can make it seem abstract. Hopefully, the knowledge that you have gained in this section has given you a different perspective when you see this heartbeat. Try thinking about what causes the valves to open and where blood is being pumped to. Next, we will explore the cardiac cycle and then move onto the pressure-volume loop.
Key Takeaways
Consider the following concepts to help guide your studies:
- Both nodal cells and cardiac myocytes are cardiac cells.
- Nodal cells are part of the electrical system, whereas cardiac myocytes are part of the contractile system.
- Pacemaker cells directly control heart rate and blood flow via electrical impulses.
- Pacemaker cells do not compete, they go at the fastest rate. In a healthy human, this is the SA node.
- If the Pathway of Conductance is altered, ventricular contraction may occur too soon or too late, impacting heart rate.
- The electrical and contractile systems work together to generate the contraction of the heart.
Subchapter Quiz
The questions below can be used to assess your knowledge within this chapter. There are five multiple-choice questions that you should attempt without referring to your notes. The questions will provide you with responses to your answers to guide your studying but should not be used as your only resource.
Media Attributions
- Heart Bioelectricity 3 © OpenStax is licensed under a CC BY (Attribution) license
- Autonomic Control © Richard Klabunde is licensed under a All Rights Reserved license
- Action Potential in Cardiac Contractile Cells © OpenStax is licensed under a CC BY (Attribution) license
- Geometric Venn Diagram with images © Lisa Wedel
- Cardiac cells comparison © Lisa Wedel
- Cardiac Conduction © OpenStax is licensed under a CC BY (Attribution) license
- Phases of the cardiac cycle © J. Gordon Betts, Kelly A. Young, James A. Wise, Eddie Johnson, Brandon Poe, Dean H. Kruse, Oksana Korol, Jody E. Johnson, Mark Womble, Peter DeSaix is licensed under a CC BY (Attribution) license
- Cingolani, E., Goldhaber, J.I., Marban, E.(2017). Next-generation pacemakers: from small devices to biological pacemakers. Nature Reviews Cardiology, 15(3), 139-150. http://doi.org/10.1038/ncardio.2017.165 ↵
- Benson, D.W., Cohen, M. (2017). Wolff-Parkinson White Syndrome: lessons learnt and lessons remaining. Cardiology in the young, 27(S1), S62-S67. http://doi.org/10.1017/S1047951116002250 ↵
- Themes, U. F. O. (2016, July 10). The Cardiac Conduction System. Thoracic Key. https://thoracickey.com/the-cardiac-conduction-system/. ↵
Type of cardiac cell that is involved in the electrical system of the heart. Examples: Atrioventricular node and Sinoatrial node.
Control heart rate and blood flow by influencing rhythmic electrical impulses.
A myocyte is a muscle cell, different types of myocytes can be found all around the body and even within the heart.
Everything that takes place between one heart beat and the next.
Charge within the cell becomes more positive (upward slope of the curve).
Charge within the cell returns to being more negative (downward slope of the curve).
The ability to spontaneously depolarize.
The membrane voltage that must be reached in an excitable cell (e.g., neuron or muscle cell) during a depolarization in order to generate an action potential.
The change in a cell's membrane potential that makes it more negative than the resting membrane potential.
Function of the electrical system of the heart.
Outcome of the electrical system of the heart, ie. conduction causes contraction.
The relaxation phase of the heart (no contraction).
The pumping or contraction phase of the heart.
