Skeletal Muscle Biophysical Characteristics
Think about the difference between copying out notes vs performing a push-up. In both of these actions, the arms muscles are being contracted. In order to create specific desired movements, the muscle needs to be able to contract at different velocities and levels of power. Skeletal muscle physiology plays a large role in controlling the characteristics of a muscle contraction. More specifically, this subchapter will introduce the relationship between the length of the sarcomere and how this affects muscle contraction force output. This subchapter also introduces the relationships between velocity, force, and power and how they affect muscle contraction.
Learning Outcomes
In this section you will learn…
- Describe the relationship between the length of a sarcomere and the force of muscle contraction.
- Understand the relationship between the velocity, force and power of muscle contraction.
Length-Tension Relationship
The following diagram provides a visual comparing percentage sarcomere length and percent of maximum tension. It is similar to the graph in your notes, except that the axes differ slightly. The x-axis in your notes looks at the length of the sarcomere in micrometers, whereas the x-axis in the following diagram uses the percentage of sarcomere length.
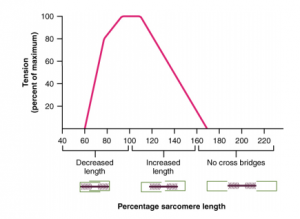
The amount of force a muscle can produce during a contraction is dependent on the length of the muscle. The maximum force a muscle can generate occurs when the sarcomere is between 80-120% of the resting length (the peak of the graph in figure 1). This means that it occurs when the muscle is slightly shortened or slightly lengthened from its resting length. The resting length is the length that would produce the maximum amount of tension possible during isometric contraction. At this length, there is optimal overlap for the cross-bridges to form.
The muscle has a reduced ability to generate tension when it is maximally lengthened or maximally shortened. This is because when it is maximally shortened, seen on the right side of the graph in figure 1, the actin and myosin filaments are completely overlapped and the actin is pressed against the z-discs (which are sort of like walls). When it is maximally lengthened, seen on the left side of the graph in figure 1,there is no ability for cross-bridges to form. Initially when the muscle is lengthening the tension is still high because the cross-bridges are being pulled apart. Once it is lengthened far enough, the cross-bridges cannot form and the tension decreases.
Did you know the optimal length of a sarcomere is very close to its resting length? Due to the presence of titin, muscles are naturally elastic. As such, if a tendon was cut from its attachment, the muscle would shorten in length because, at rest, it is naturally stretched.
Force-Velocity Relationship
The following graph depicts the relationship between velocity and force (and thus, power) of muscle contraction. This graph is useful because it shows the relationship with more details than in your notes. As such, this graph is above the HK*2810 course level.
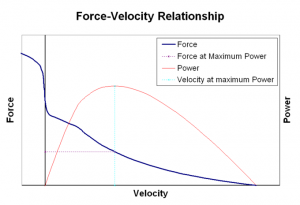
During a concentric contraction, an increase in velocity results in a decrease in force production. Conversely, a velocity of zero (isometric contraction) will result in maximal force production. This is indicated by the purple line on the graph. Eccentric contractions correspond to the lengthening of a muscle, opposing concentric contractions which represent shortening. As a result, these 2 types of contractions will occur opposite to each other in direction.
Test Your Knowledge
Thinking Beyond:
How would the force-velocity graph look for different muscles throughout the body? Would it look any different? Would the shape change at all? If something is too heavy to be lifted, where does this situation fit on the Force-Velocity graph above? What is the name of this type of contraction? Hint: Does every muscle in the body have the ability to produce the same amount of force?
If you multiply force and velocity, you get power. Maximal power is achieved when the force and the velocity are approximately one-third of their maximum, which can be seen in the graph by the light blue and light purple lines. If you don’t understand why this is how it is let’s think about it. At a high force and low velocity, there will be relatively low power. As you increase the velocity slightly more than the decrease in force, the power will increase. There will reach a peak when the increase in velocity and decrease in force will produce the maximum potential power. Then velocity continues to increase while force decreases at a slightly greater magnitude, thus the power decreases.
Key Takeaways
- Muscle force production during a contraction is dependent on muscle length.
- Maximal force generation is between 80-120% of the resting length due to optimal overlap in cross-bridges. When maximally lengthened or shortened, the actin and myosin filaments are completely overlapped leaving no ability for new cross-bridges to form.
- Increases in contraction velocity correspond with decreases in force production. Maximal force generation occurs during isometric contractions where there is a velocity of zero.
- Power is a measure of force multiplied by velocity. Maximal muscle power occurs at 1/3 of maximal force and velocity.
Subchapter Quiz
The questions below can be used to assess your knowledge within this chapter. There are four multiple-choice questions that you should attempt without referring to your notes. The questions will provide you with responses to your answers to guide your studying but should not be used as your only resource.
Media Attributions
- Lenth-tension relation © Boundless.com is licensed under a CC BY-SA (Attribution ShareAlike) license
- Force-Velocity Relationship © Boundless.com is licensed under a CC BY-SA (Attribution ShareAlike) license
A type of muscle contraction where the muscle is not lengthening or shortening, but rather is at a constant length.
The interaction between actin and myosin that occurs during muscle contraction.
A type of muscle contraction in which the muscle is actively shortening.
