Glucose Regulation
This section will give us a look at the importance of maintaining blood glucose levels in the body and how this is regulated. You will learn about the processes and hormones involved in changing glucose concentrations in the blood. You will gain an understanding of the difference between insulin and glucagon and how and when they work to modify blood glucose levels to maintain homeostasis. Furthermore, you will learn how glucose is synthesized by various enzymes through gluconeogenesis and how glucose is broken down through the process of glycolysis. We will also explore the role of the pancreas in generating and secreting hormones necessary for glucose regulation. Several real-world examples will be given to further your understanding.
Learning Outcomes
In this section you will learn…
- The use of glucose as fuel in the body.
- Storage of excess glucose as glycogen and lipids.
- Synthesis of glucose from glycogen, lipids and protein.
- The exocrine and endocrine pancreas.
- Regulation of glucagon and insulin release.
- Effects of insulin and glucagon throughout the body.
- Role of insulin and glucagon in maintaining blood glucose homeostasis.
Glucose Storage, Usage and Regulation
Overview
Glucose is a simple sugar that is required for energy (ATP) production throughout the body. Due to the central importance of glucose as a source of energy in the body, blood glucose concentrations are constantly monitored and regulated through physiological mechanisms.[1] The pancreas, a glandular organ in the abdomen, is the main source of hormones that are used to regulate blood glucose. These hormones, including insulin and glucagon, maintain blood glucose concentrations within a narrow range between 4 and 5 mmol/L. Even a slight decrease in blood glucose levels, to less than 2-3 mmol/L, can cause dizziness, confusion, seizures, coma and even death. These symptoms occur because glucose is the primary fuel source used by the brain. In desperate circumstances the brain can use ketone bodies that are derived from fat, however this is not ideal. In states of hypoglycemia the brain limits its glucose use, shutting off all functions not required for survival which causes impaired cognitive functioning. In extreme and prolonged states of hypoglycemia the brain starves, leading to cerebral damage and possibly death.[2] The body is better at tolerating elevated blood glucose levels but runs into problems when concentrations rise above 30-40 mmol/L. When blood glucose concentrations are high, excess glucose is removed from the body at the level of the kidney. The kidney is very good at removing excess glucose from the blood, however water follows the glucose by osmotic draw and is also excreted from the body. This leads to osmotic diuresis, or increased urine production, and can lead to severe dehydration.[3]Ideally, any excess glucose is stored within the muscle and liver as glycogen and within the adipose tissue as triglycerides. Once glucose is absorbed into skeletal muscle cells or adipocytes it is trapped and must be used by that cell. Only the liver is capable of releasing glucose back into circulation. Skeletal muscle and adipose tissue can indirectly liberate glucose by releasing molecules such as amino acids and lipid byproducts into the blood. These molecules can then be taken up and used by the liver to make new glucose molecules that can be released in circulation.
Glucose in the Cell
During digestion carbohydrates are broken down into simple soluble sugars like glucose that can be transported across the intestinal wall into the circulatory system. Once in circulation, absorbed glucose is transported into tissues and the process of cellular respiration begins. Glucose enters cells around the body through glucose transporters by facilitated diffusion. Thus, in order for glucose to get into the cells a concentration gradient must be established with glucose levels being higher outside of the cell. There are 15 different glucose transporters found throughout the body; however, for the purpose of this chapter we will focus on 2 main types: (1) GLUT2 which is found in the liver and (2) GLUT4 which is found in skeletal muscle and adipose tissue. The GLUT4 transporter is special because it is insulin sensitive – whenever skeletal muscle or adipocytes interact with the hormone insulin, GLUT4 transporters are recruited to the cell surface. When insulin levels are low GLUT4 transporters are recycled slowly between the cell membrane and cell interior.[4]
When glucose enters a cell, the enzyme hexokinase in muscle and adipose or glucokinase in the liver rapidly adds a phosphate to convert it into glucose-6-phosphate(G6P). This conversion step essentially traps the glucose in the cell, preventing it from passing back through the plasma membrane, thus allowing glycolysis to proceed. This process also functions to maintain a concentration gradient with higher glucose levels in the blood than in the tissues. By establishing this concentration gradient, the glucose in the blood will be able to flow from an area of high concentration (the blood) into an area of low concentration (the tissues) to be either used or stored. G6P can then enter one of two pathways: (1) glycolysis for energy release or (2) glycogenesis for storage. Glycolysis is a series of metabolic steps that breaks down one glucose molecule into two pyruvate molecules, and creates two net ATP molecules and two NADH molecules. Thus, glycolysis generates energy for the cell and creates pyruvate molecules that can be processed further through the citric acid cycle (aerobic respiration) or converted into lactic acid (anaerobic respiration). During the citric acid cycle, high-energy molecules, including ATP, NADH, and FADH2, are created. NADH and FADH2 then pass electrons through the electron transport chain in the mitochondria to generate ATP. When glucose levels are plentiful, any excess acetyl CoA generated by glycolysis can be converted into fatty acids and triglycerides. This process, called lipogenesis, creates lipid droplets for storage of energy and takes place in adipocytes (fat cells) and hepatocytes (liver cells). Additionally, when there is sufficient energy in the cell G6P will be used for glycogen synthesis (glycogenesis) rather than entering glycolysis. Glycogenesis, is the formation of glycogen (a storage molecules) from glucose by the enzyme glycogen synthase. This process occurs in the liver and muscle cells when glucose and ATP are present in relatively high amounts.[5]
When blood glucose levels fall, as during fasting, the opposite reactions occur within the cell. Glycolysis is reduced and fuel stores, including glycogen and lipid droplets, are broken down to release energy. Glycogenolysis occurs mainly in the liver and skeletal muscle and is the process of breaking down glycogen stores back into glucose to provide immediate energy and maintain blood glucose levels. During each round of glycogenolysis the enzyme glycogen phosphorylase removes one molecule of G6P, leaving the remaining chain of glycogen with one less molecule of glucose. In the muscle, the liberated glucose must be used inside the cell for energy. The liver, however, can release the glucose back into the blood stream. To obtain energy from fat, triglycerides in the liver or adipose tissue are broken down by hydrolysis into their two principle components; free fatty acids and glycerol. This process is called lipolysis. Glycerol from fat, along with pyruvate, lactate and glucogenic amino acids can also be used by the liver to create new molecules of glucose. This process is termed gluconeogenesis.[6]
All of these cellular mechanisms fall under the control of two main hormones: insulin and glucagon. These hormones are generated and secreted by the pancreas and work together to maintain optimal blood glucose concentrations.
The following diagram demonstrates an overview of aerobic respiration. You do not need to know the whole process in detail, but it is expected that you have a base understanding of this process from your previous courses, focussing on the big picture.
The Pancreas
The pancreas is a glandular organ located in the abdomen. It plays a critical role in converting the food we eat into fuel for our bodies. In terms of functionality, the pancreas can be broken down into two main parts the exocrine pancreas which aids in digestion and the endocrine pancreas which regulates blood sugar.
Exocrine Pancreas
The bulk of the pancreas is composed of exocrine cells which produce enzymes that aid in digestion. When food enters the stomach, the exocrine cells release their digestive enzymes into a series of small ducts that eventually join together into the main pancreatic duct. The pancreatic duct runs the length of the pancreas and releases the digestive enzymes along with other secretions, collectively called pancreatic juice, into the small intestine.[7]
Endocrine Pancreas
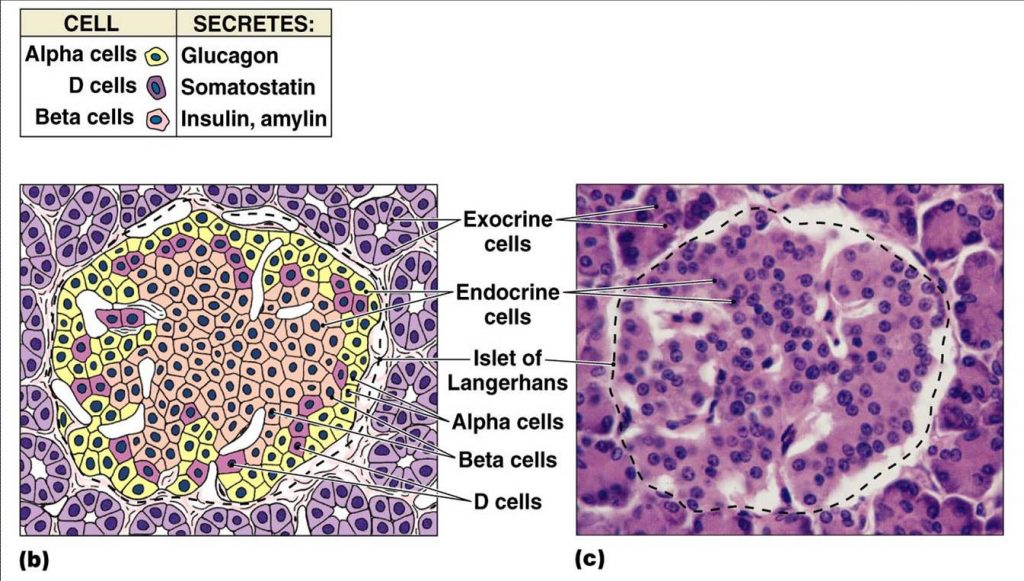
The second functional component of the pancreas is the endocrine pancreas. The endocrine pancreas is composed of small islands of cells called the islets of Langerhans. There are at least 4 cell types found within the islets which produce hormones that are released into the blood stream and help regulate blood glucose levels. This information is summarized in table 1.[8]
- Alpha (α) cells – produce the peptide hormone glucagon and make up approximately 20% of each islet. Glucagon is released in response to low blood glucose levels and has several effects throughout the body that together raise blood glucose levels.
- Beta (β) cells – produce the peptide hormone insulin and make up approximately 75% of each islet. Insulin is released in response to elevated blood glucose level. Its primary function is to facilitate the uptake of glucose into cells.
- Delta (Δ) cells – produce the peptide hormone somatostatin and make up approximately 4% of each islet. Pancreatic somatostatin inhibits the release of both glucagon and insulin.
- F or PP cells – produce the peptide hormone pancreatic polypeptide and make up approximately 1% of each islet. Pancreatic polypeptide is thought to play a role in appetite as well as in the regulation of pancreatic exocrine and endocrine secretions.
| Hormone | Chemical class | Effect |
|---|---|---|
| Insulin (β cells) | Peptide | Reduces blood glucose levels |
| Glucagon (α cells) | Peptide | Increases blood glucose levels |
| Somatostatin (Δ cells) | Peptide | Inhibits insulin and glucagon release |
| Pancreatic polypeptide (F/PP cells) | Peptide | Role in appetite |
The functional distribution of the four cell types within the islets of Langerhans is shown in figure 2. Beta cells, which make up the majority of the islets, are located centrally and surrounded by the alpha, delta and F cells. This learning object is above the course level and for your information only.
Tips From Past Students
This learning object is beyond what you are expected to know; however, think about where the cell type subsets are situated and the functional role location might have. Glucagon and insulin are antagonistic hormones and somatostatin inhibits them both! It makes sense that they are all found close together.
Paracrine Signalling in the Pancreas
Before pancreatic hormones make it into circulation and act on tissues around the body, they first play a role in paracrine regulation of the pancreas itself. This paracrine feedback system is demonstrated in figure 3. Take note of the signalling contrast between glucagon and insulin and somatostatin. Glucagon will always stimulate the release of the other two hormones, while insulin and somatostatin both have an inhibitory effect on the other hormones in this relationship. Insulin and glucagon have opposing actions on one another, so if you learn one, you know the other! And remember that somatostatin will always inhibit both insulin and glucagon release.
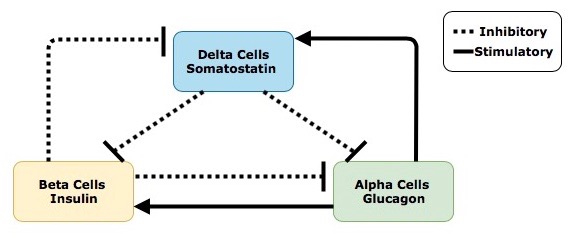
Secretion of insulin, from beta cells within the islet of Langerhans, inhibits the surrounding alpha cells from releasing glucagon and the delta cells from releasing somatostatin. Secretion of glucagon, which is antagonistic to insulin, stimulates the delta cells to release somatostatin. Interestingly, glucagon also activates the beta cells and stimulates insulin release. Considering insulin and glucagon have opposing actions throughout the body this may seem counterintuitive. To better understand why this occurs imagine a runner nearing the end of a marathon – after running almost 42 kilometers, glucose within the body will be severely depleted. In order to correct this state of hypoglycaemia, alpha cells in the pancreas will release glucagon, resulting in the production and liberation of glucose from the liver and adipocytes. Insulin is then needed to help cells around the body (especially the skeletal muscle cells) absorb the liberated glucose and use it for energy. This interplay between glucagon and insulin allows the runner to keep moving and finish the race! It is also important to understand that not all regulatory signals are equal; the stimulatory effects that glucagon has on beta cells is much smaller than the stimulatory effects of increased blood sugar after eating a meal. Lastly, secretion of somatostatin within the islets inhibits the activity of both the beta and alpha cells.
Regulation of pancreatic hormones is a complex process, involving much more than just the paracrine feedback system within the islet of Langerhans. Secretion of insulin and glucagon is controlled by the integration and interaction of multiple inputs including nutrients, hormones, neurotransmitters and drugs. For both insulin and glucagon, changes in blood glucose concentrations are the primary stimuli that activates, or inhibits, their release. Blood glucose is the regulated variable within this system, meaning it is constantly monitored by sensors (i.e. receptors) in the body and kept within a limited range through physiological mechanisms.[10] Within our bodies, blood glucose levels are tightly maintained between 4-5 mmol/L (70-110 mg/dL).[11] Insulin and glucagon are antagonistic hormones, meaning they respond through opposing mechanisms to changes in blood glucose levels. When the body is in a state of hyperglycemia, and blood glucose levels are elevated, sensors in the pancreas detect this and stimulate the beta cells to increase their release of insulin. When blood glucose levels drop, putting the body is in a state of hypoglycemia, the alpha cells are stimulated and glucagon is released. The integration of blood glucose levels, and other regulatory stimuli, on alpha and beta cells is discussed in further detail below.
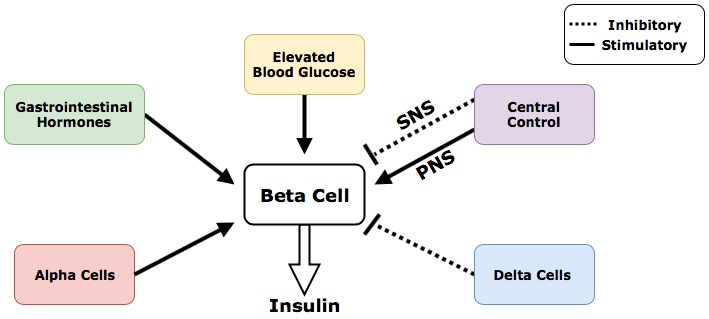
The following figure depicts how insulin release is regulated by different inputs throughout the body. Keep the big picture in mind. Which one of the following exhibits paracrine control? Endocrine?
Regulatory Inputs That Control Insulin Release
- Elevated blood glucose is the primary regulatory input that stimulates beta cells to release insulin to clear blood glucose
- Alpha cells within the pancreas release glucagon that stimulates the beta cells through paracrine regulation
- Delta cells within the pancreas release somatostatin that inhibits the beta cells through paracrine regulation
- Gastrointestinal (GI) hormones stimulate the beta cells to release insulin through a feed-forward system.Feed-forward systems work by modifying processes based on anticipated results. The presence of food in the gastrointestinal tract causes the release of hormones including gastrin, secretin and cholecystokinin. The release of these hormones indicates that the products of digestion, including glucose, fats and amino acids, will soon be absorbed and enter the blood stream. In anticipation of this, the GI hormones stimulate the beta cells to increase insulin production. Insulin then travels to tissues throughout the body and prepares them for the arrival and uptake of incoming nutrients.[12]
- Central control of insulin is achieved through innervation of the pancreas by the central nervous system. Central control of beta cells can be further divided into neural inputs from the parasympathetic nervous system and sympathetic nervous system. The parasympathetic nervous system, which control our bodies “rest and digest” functions, stimulates the beta cells to release insulin.[13] Conversely the sympathetic nervous system, which controls the bodies “fight or flight” functions, inhibits the beta cells from releasing insulin.[14]
Regulation of Glucagon Release
The following figure demonstrates how the release of glucagon from alpha cells is regulated by different inputs throughout the body. Remember that both insulin and somatostatin will both inhibit the secretion of glucagon from alpha cells in the pancreas. This diagram does an excellent job of summarizing glucagon’s regulatory inputs and would be a helpful tool when studying for exams!
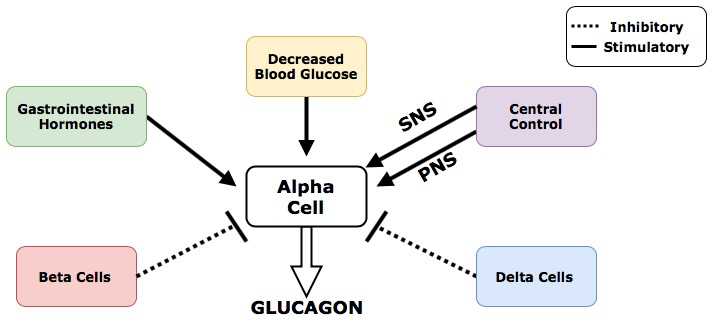
Regulatory Inputs That Control Glucagon Release
- Decreased blood glucose is the primary regulatory input that stimulates alpha cells to release glucagon
- Beta cells within the pancreas secrete insulin that inhibits the function of alpha cells through paracrine regulation
- Delta cells within the pancreas secrete somatostatin that inhibits the function of alpha cells through paracrine regulation
- Gastrointestinal hormones stimulate the alpha cells to release glucagon through a feed-forward system. The mechanisms of this feed-forward system are similar to the ones used to regulate insulin expect in this case the body is preparing for the absence of incoming nutrients. The gastrointestinal hormones that stimulate the alpha cells are secreted much later in the digestive process, and further down the digestive tract that those used to regulate insulin. The release of this set of GI hormones signals to the body that digestion is almost done and no more food is coming. In anticipation of this, the gastrointestinal hormones stimulate the alpha cells to increase production of glucagon.
- Central control of glucagon includes innervation of the pancreas by the central nervous system. Neural inputs from both the parasympathetic and sympathetic nervous system stimulate the alpha cells to release glucagon. This is one of the rare occasions in the body where these two systems carry out the same function. (The SNS and PNS typically work in opposition, with the SNS preparing the body for stress and the PNS maintaining homeostatic and rest functions.)
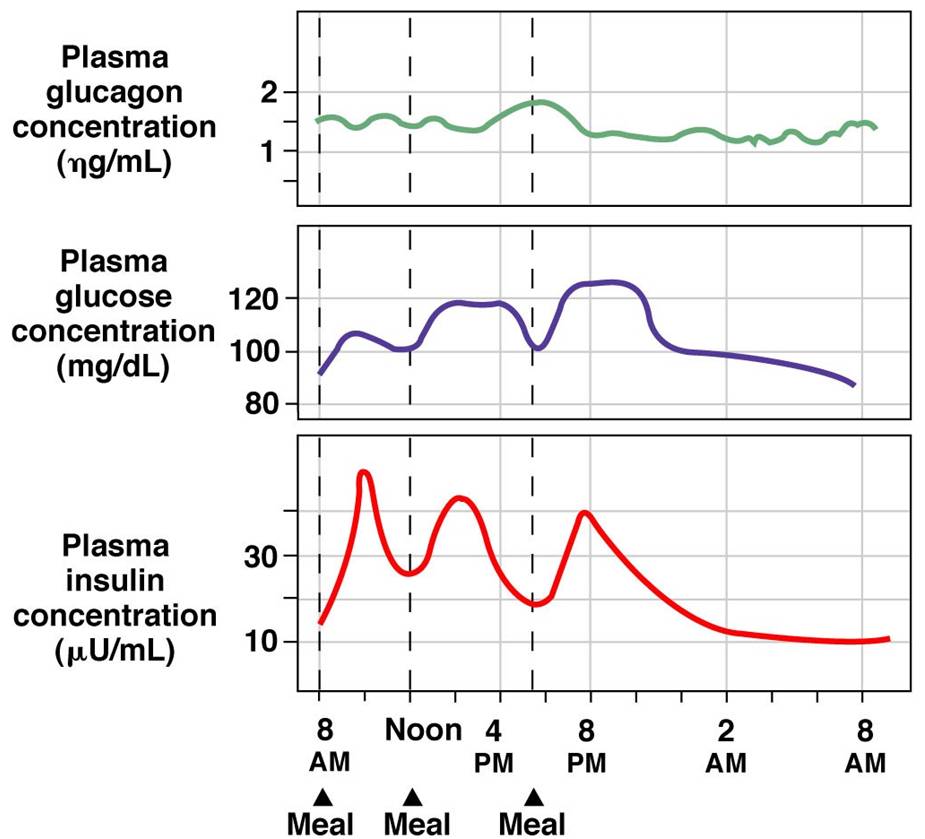
The endocrine pancreas is always secreting some level of insulin and glucagon.[15] Although these hormones are antagonistic, they do not act in isolation. Rather than being an “on-off” system, insulin and glucagon function along a gradient. Figure 6 (below) shows how plasma concentrations of glucose, glucagon and insulin change over a 24-hour period. Pay close attention to how these levels change before and after a meal and the relationships between the different plasma concentrations.
Tips From Past Students
Don’t get caught up in memorizing the numbers on these graphs! Think about the relationship between insulin, glucagon and glucose and what causes fluctuations to each. This diagram presents information that you have already learned in a new way!
As one hormone increases its activity the other one decreases but is never completely shut off. All inputs that regulate the activity of alpha and beta cells combine in the pancreas. The overall summation of these inputs determines if the system favours insulin or glucagon release.[16] This concept is demonstrated in figure 6 which shows how concentrations of plasma glucose, insulin and glucagon change over a 24hour period. After eating a meal glucose levels rise.
In response to this the body increases the concentration of insulin in the blood and decreases the concentration of glucagon. The opposite effect is seen in between meals when blood glucose concentration decreases – now blood glucagon concentrations rise and insulin concentrations fall. Take note that the concentration of both insulin and glucagon in the blood never reaches 0, there is always some level of hormone being secreted from the pancreas.
Test Your Knowledge
Thinking Beyond:
We know that regardless of blood glucose levels, the concentrations of insulin and glucagon never reach zero. Why do you think that is? Hint: Think about what would happen if you needed to produce a hormone quickly and it was not readily available.
Function of Insulin
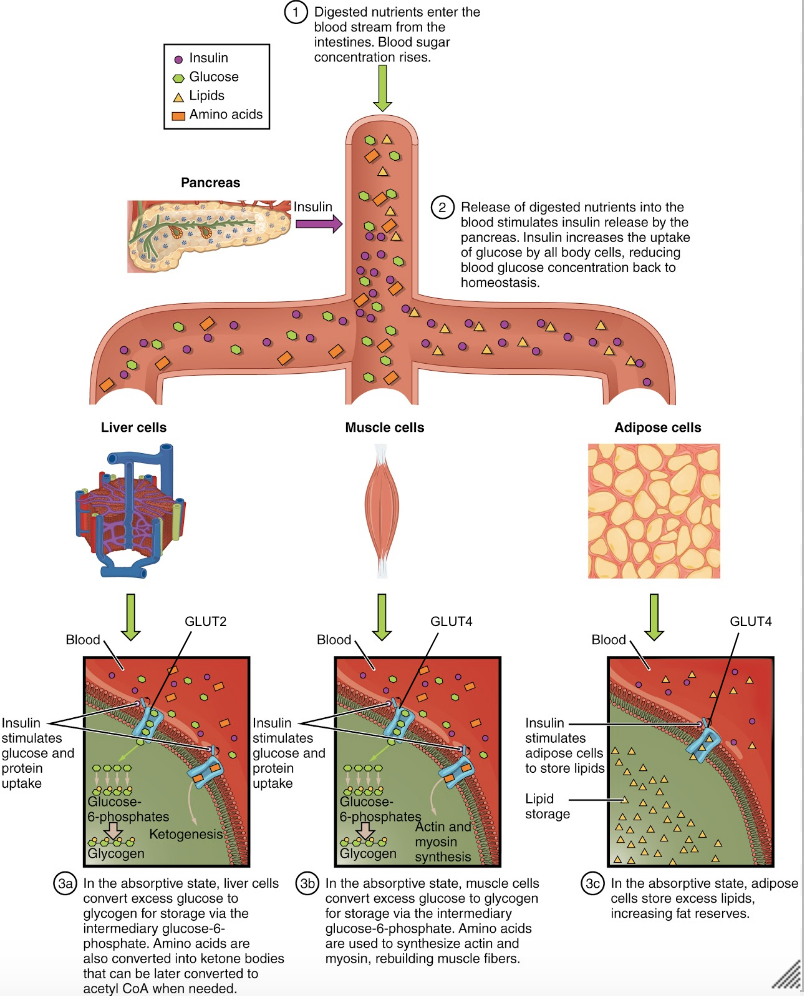
So far we have covered where insulin and glucagon come from, and how they are regulated. Now we will dive into the effects these hormones have on the body. The absorptive state, or the fed state, occurs after a meal when your body is digesting the food and absorbing the nutrients.. Digestion begins the moment you put food into your mouth, as the food is broken down into its constituent parts to be absorbed through the intestine. The digestion of carbohydrates begins in the mouth, whereas the digestion of proteins and fats begins in the stomach and small intestine. The constituent parts of these carbohydrates, fats, and proteins are transported across the intestinal wall and enter the bloodstream (sugars and amino acids) or the lymphatic system (fats). The ingestion of food and the rise of glucose concentrations in the bloodstream stimulate pancreatic beta cells to release insulin.[17] This insulin then acts on many tissues around the body to stimulate the uptake and utilization of blood glucose. For the purpose of this course we will focus on the effects of insulin in adipose tissue, skeletal muscle and the liver.
Figure 7 (below) provides a visual representation of how the adipose tissue, skeletal muscle and liver respond to an increase in insulin, caused by high blood glucose levels. Note the negative feedback that allows this response to be highly regulated.
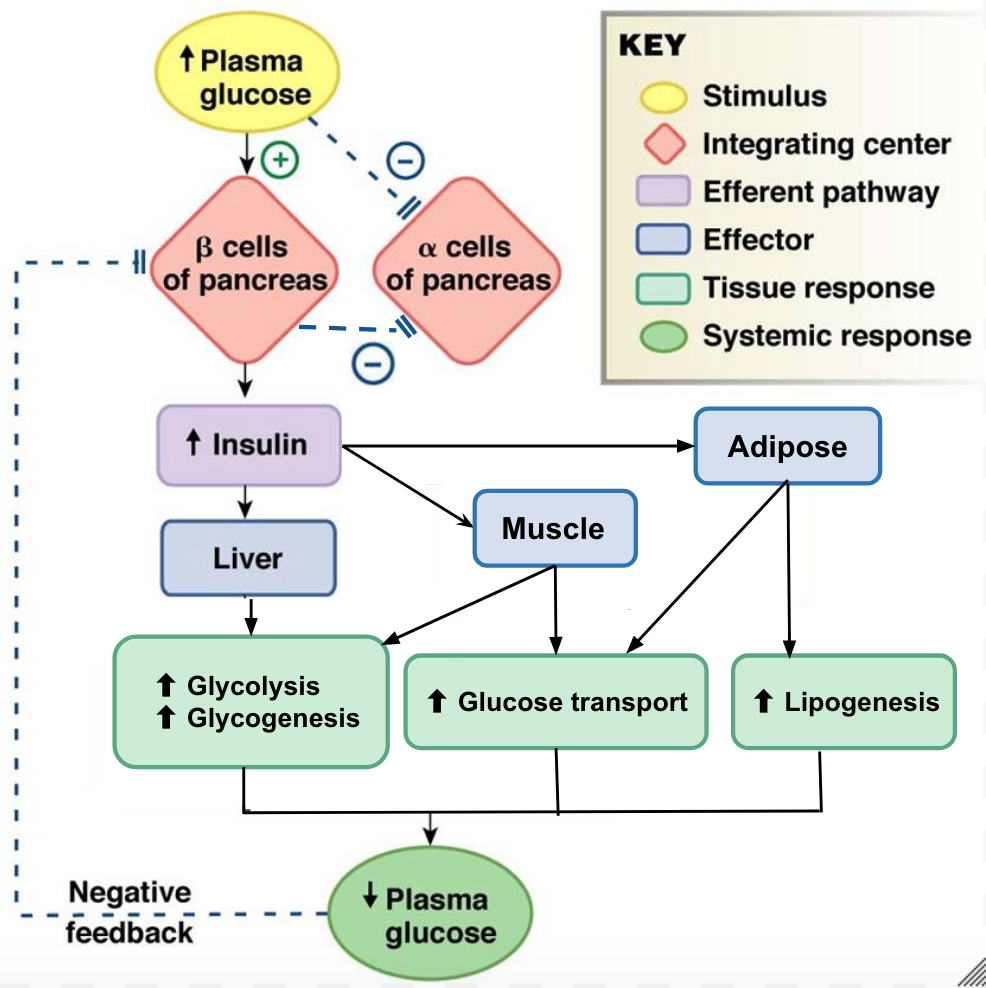
Adipose Tissue
In adipose tissue, when insulin concentrations are low, glucose transport proteins are recycled slowly between the cell membrane and cell interior.[18] When insulin levels increase it can bind to receptors on the adipocyte and trigger recruitment of the glucose-transporter vesicles to the cell surface. Vesicles then fuse with the cell membrane and expose the GLUT4 transporters to the extracellular fluid.[19] The transporters then move glucose by facilitated diffusion into the cells interior. Insulin also increases the activity of pyruvate dehydrogenase and acetylCoA carboxylase within adipocytes, facilitating the conversion of absorbed glucose into triglycerides for lipid storage.
Skeletal Muscle
In a similar fashion to adipose tissues, insulin causes the recruitment of GLUT4 transporters to the surface of skeletal muscle cells.[20] Increasing the number of glucose transporters in the cell membrane allows skeletal myocytes to increase their glucose uptake. Insulin further reduces blood glucose levels by stimulating glycolysis, the metabolism of glucose for generation of ATP, in the muscle. This is achieved by activating the enzymes phosphofructokinase and pyruvate dehydrogenase. Insulin also stimulates skeletal muscle to convert excess glucose into glycogen for storage (by activating glycogen synthase) and it inhibits enzymes involved in glycogenolysis (glycogen phosphorylase). Lastly, insulin stimulates amino acids uptake and protein synthesis in the muscle tissue.
Liver
Insulin increases absorption of blood glucose into hepatocytes by promoting the conversion of glucose into glucose-6-phosphate (G6P). This is achieved through activation of the enzyme glucokinase and inhibition of glucose-6-phosphatase. By immediately converting glucose into G6P, the cell can maintain a concentration gradient where glucose levels are higher in the blood and lower inside the cell.[21] This allows glucose to continue moving from the blood into the liver by facilitated diffusion through the GLUT2 transporter.[22] Insulin also stimulates the liver to convert excess glucose into glycogen for storage. Insulin increases the activity of enzymes involved in glycogen synthesis (glycogen synthase) and inhibits enzymes used for glycogenolysis (glycogen phosphorylase). Once glycogen stores within the liver are filled, any remaining glucose is broken down and used for triglyceride synthesis and lipid storage. The figure below is an effective visual representation of the effects of insulin on liver, muscle and adipose cells in the absorptive state.
Did you know not all cells require insulin for efficient uptake of glucose? Red blood cells, as well as cells of the brain, liver, kidneys and lining of the small intestine do not require insulin for efficient uptake of glucose! These cells don’t use GLUT4 to import glucose, but rather, another transporter that is not insulin-dependent.[23]
Function of Glucagon
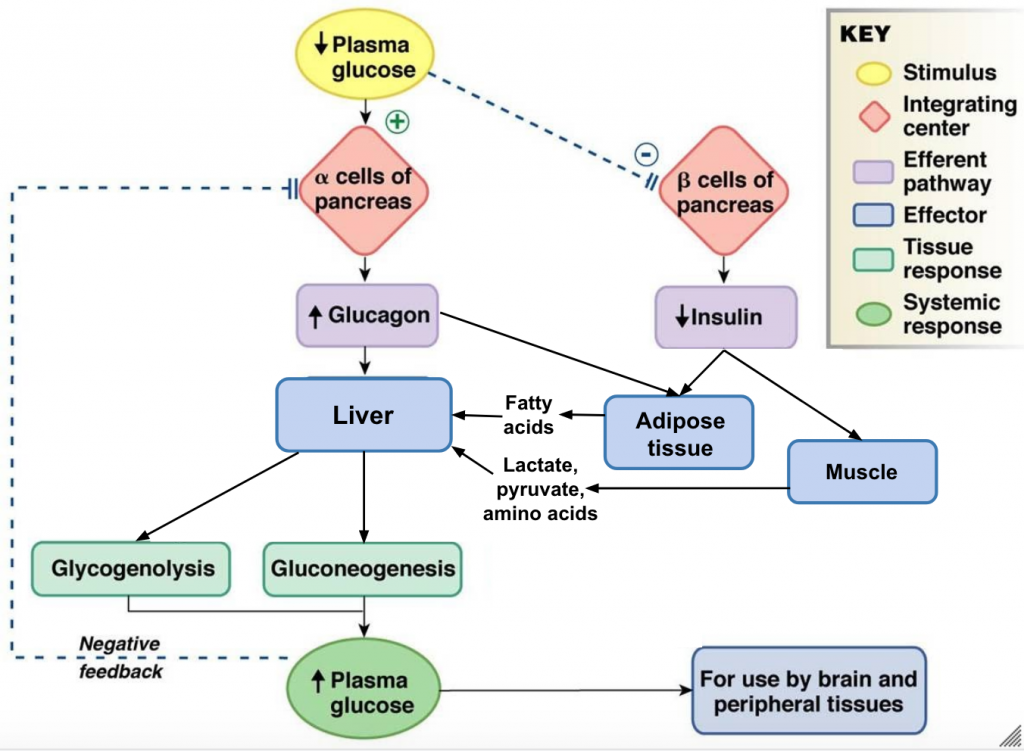
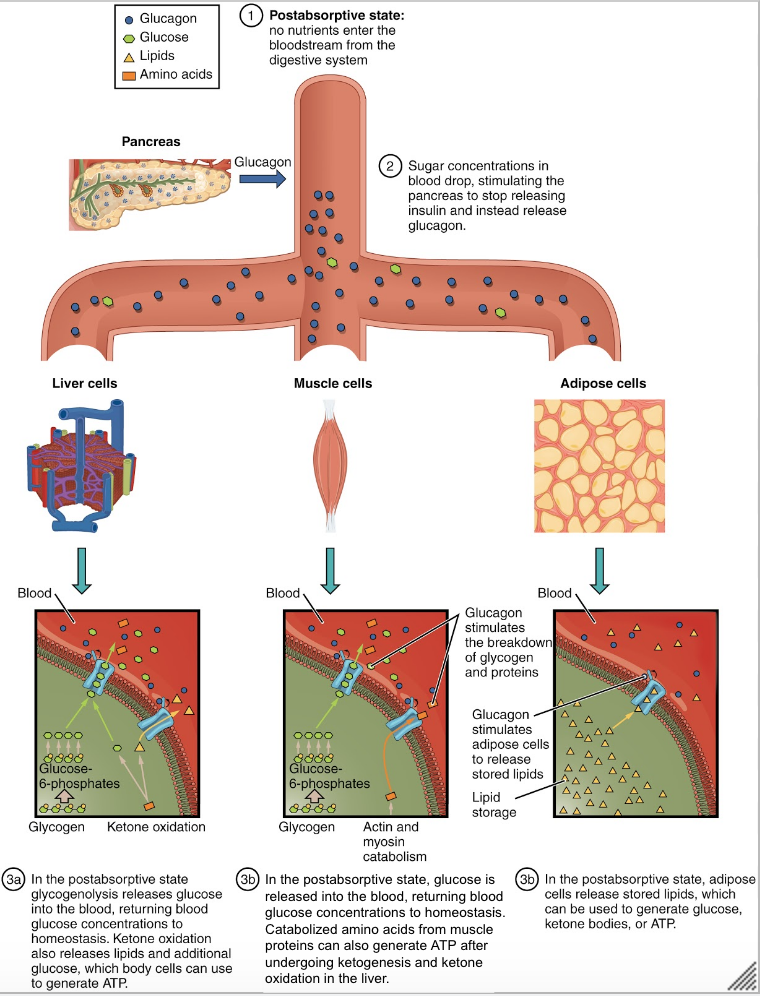
The post-absorptive state, or the fasting state, occurs when food has been digested, absorbed, and stored. You commonly fast overnight, but skipping meals during the day puts your body in the post absorptive state as well. During this state, the body must rely initially on stored glycogen. Glucose levels in the blood begin to drop as it is absorbed and used by the cells. In response to the decrease in glucose, insulin levels also drop. Glycogen and triglyceride storage slows. However, due to the demands of the tissues and organs, blood glucose levels must be maintained in the normal range of 4-5 mmol/L. In response to a drop in blood glucose concentration, the hormone glucagon is released from the alpha cells of the pancreas. Glucagon acts upon primarily the liver and adipose cells.[24] The diagram below depicts an overview of the body’s response to low blood glucose. Take note that glucagon’s end goal is the opposite of insulin’s – it wants to increase plasma glucose.
Tips From Past Students
This diagram has a lot of processes and it can be a bit overwhelming to make sense of all of it at once. It is helpful to look at the big picture first, and then add in more details as you become more and more comfortable with the material.
Liver
The liver is the only tissue in the body that can make glucose “from scratch” and directly release glucose back into the blood. When blood sugar levels drop glucagon stimulates the liver to convert its stores of glycogen back into glucose. This response is known as glycogenolysis and is achieved by increasing the activity of glycogen phosphorylase and decreasing the activity of glycogen synthase. This glucose is then released from the liver to be used by the peripheral tissues and the brain. As a result, blood glucose levels begin to rise. Gluconeogenesis will also begin in the liver to replace the glucose that has been used by the peripheral tissues.[25] The liver will take up glucogenic amino acids and lipid by-products from the blood and convert them into glucose through a process termed gluconeogenesis. To insure most of the the glucose being made in the liver is released into circulation for use by body cells, glucagon inhibits glycolysis by turning down the activity of phosphofructokinase and pyruvate dehydrogenase. Glucagon also increases release of glucose into the blood by activating glucose-6-phosphatase and inhibiting glucokinase which allows any G6P within the cell to be converted back to glucose.
Adipose
Glucagon stimulates adipose tissue to breakdown stored triglycerides into free fatty acids and glycerol through a process called lipolysis. Some of the free glycerol is released into the blood stream and travels to the liver where it is used for gluconeogenesis.[26] The following figure shows the effect of insulin on liver, muscle and adipose cells in the post-absorptive state. The effect of glucagon on skeletal muscle is beyond the scope of the course, so just focus on the effects on liver and adipose cells.
Integration
So far in this chapter, insulin and glucagon have been discussed separately. This final section will show how insulin and glucagon work together in the body to maintain blood glucose homeostasis. Glucagon and insulin are antagonistic hormones and it can be helpful to think of them in terms of their opposing actions.
| Insulin | Glucagon |
|---|---|
| Main function = uptake and storage of glucose | Main function = liberation of glucose |
| Acts on skeletal muscle cells, adipocytes and liver cells | Acts on adipocytes and liver cells |
| Activates anabolic/synthesis enzymes
(hexokinase, glucokinase, glycogen synthase, phosphofructokinase, pyruvate dehydrogenase, pyruvate kinase, acetyl CoA carboxylase and fatty acid synthase) |
Activates catabolic/lysis enzymes
(glucose-6-phosphatase, glycogen phosphorylase) |
| Increases glucose uptake, glycolysis, glycogen synthesis and triglyceride synthesis | Increases glucose release, glycogenolysis, gluconeogenesis and lipolysis |
Maintenance of Blood Glucose Homeostasis
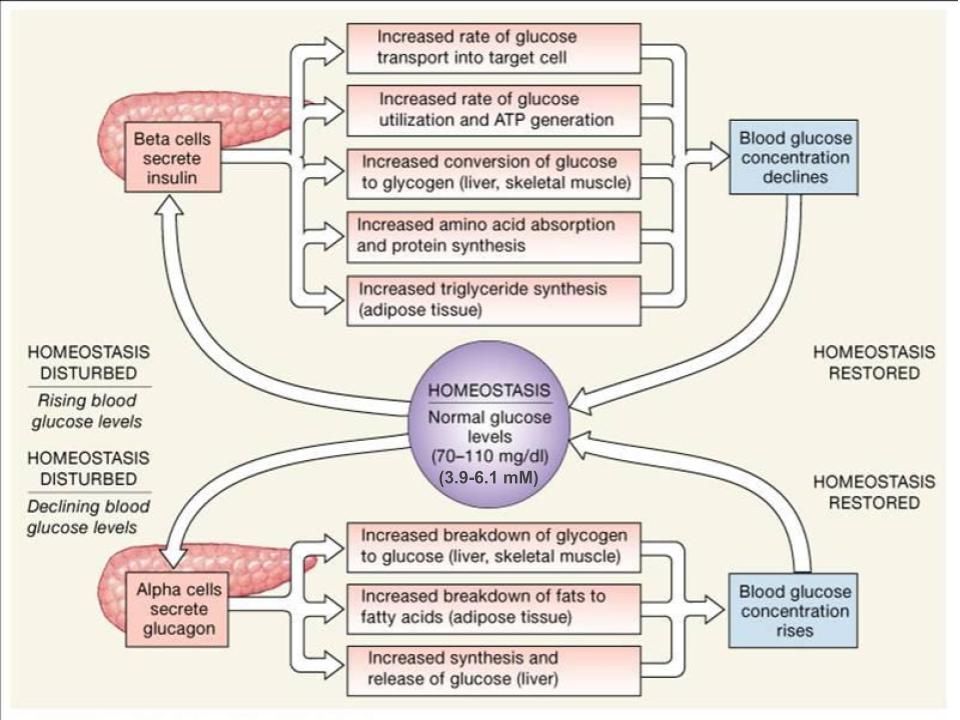
Blood glucose concentrations are tightly maintained between 4 and 5 mmol/L (70mg/dL and 110mg/dL). If blood glucose concentration rises above this range, insulin is released, which stimulates body cells to remove glucose from the blood. This is achieved by increasing the rate of glucose transport into target cells, the use of glucose to generate ATP through glycolysis, storage of glucose as glycogen, triglyceride synthesis and lipid droplet formation, and amino acid absorption and protein synthesis.
If blood glucose concentration drops below this range glucagon is released, which stimulates body cells to release glucose into the blood. This is achieved by stimulating the breakdown of glycogen to glucose, the breakdown of triglycerides into glycerol and free fatty acids as well as increased synthesis and release of glucose. The following diagram is a visual representation of the consequences of a disturbed blood glucose homeostasis and how the body works to re-establish homeostasis via the opposing actions of glucagon and insulin to maintain plasma glucose homeostasis.
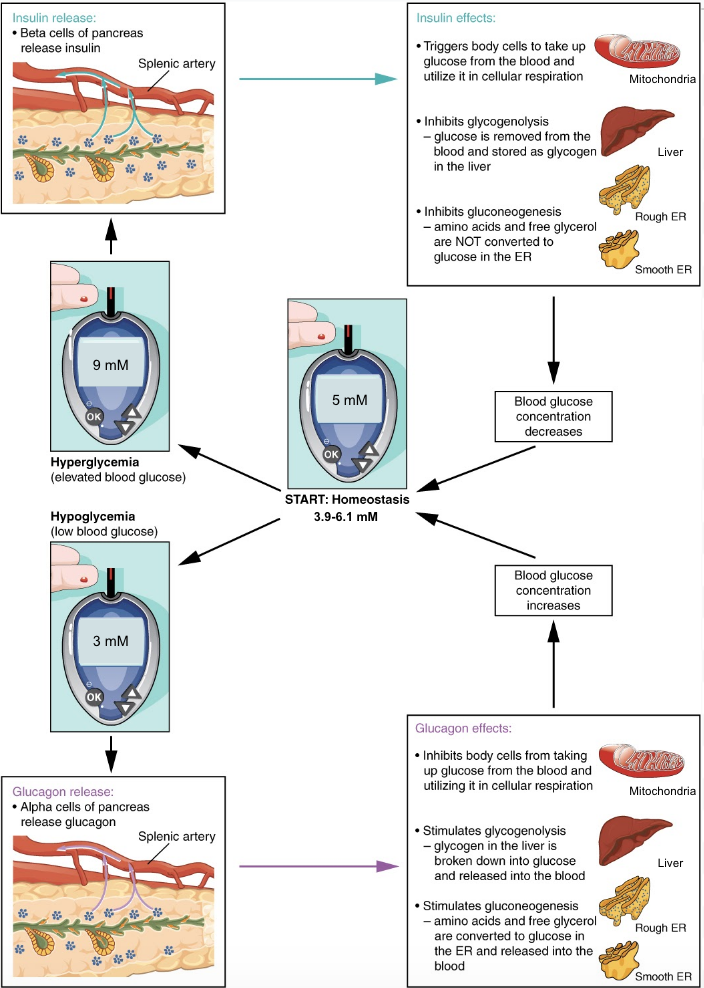
Take note that insulin will always want to build and store molecules, while glucagon will always want to break down molecules. By having opposing mechanisms throughout the body glucagon and insulin are able to work together and maintain blood glucose homeostasis. As one hormone increases its concentration and activity in the body the other one decreases. This hand off in function keeps blood glucose levels within the optimal range necessary for survival. The following figure displays the effects of insulin and glucagon on the body, as they work to restore homeostasis. Pay attention to the different organs that are targeted by these hormones and how they result in a change in plasma glucose levels.
Tips From Past Students
When trying to differentiate between glycolysis, glycogenesis, gluconeogenesis, lipolysis and lipogenesis it can be very overwhelming and confusing. Remember that “lysis” means “breakdown”, “genesis” means “formation” and that “neo” means “new”. Also remember that “glyco” and “gluco” refers to glucose and “lipo” refers to fats.
Application: Diabetes
Diabetes is a chronic disturbance of glucose homeostasis, which the body cannot fix on its own. There are several different types of diabetes outlined below.
Type 1 Diabetes
Type 1 diabetes is an autoimmune condition that often presents at a young age. For this reason, it is sometimes called juvenile diabetes. In type 1 diabetes the immune system destroys the insulin-secreting beta cells in the pancreas. People with type 1 diabetes often experience very high blood sugar cannot absorb or use much of it due to low insulin levels.
Type 2 Diabetes
Type 2 diabetes is the most common type of diabetes and usually develops due to lifestyle issues, such as being overweight. People with type 2 diabetes have insulin resistance, which means that the cells do not respond properly when insulin instructs them to absorb glucose from the bloodstream. Over time, type 2 diabetes makes your body produce less insulin, which further raises your blood sugar levels.
Gestational Diabetes
Some women develop gestational diabetes late in their pregnancies. In gestational diabetes, pregnancy-related hormones may interfere with how insulin works. This condition normally disappears after the pregnancy ends. However, if you’ve had gestational diabetes, you’re at greater risk of developing type 2 diabetes in the future.
Test Your Knowledge
Real-Life Scenario:
We know that in people with type 1 diabetes, their immune system destroys beta cells in the pancreas. If you had a disease in which the immune system destroys alpha cells in the pancreas instead, what effects would this disease have on your body in a fed state? What about a few hours after eating a meal? Hint: Think about what alpha cells are doing in each of these states.
Gestational diabetes occurs in pregnant women when hormones block insulin release. What effect would this have on the blood glucose levels? Gestational diabetes also increases the risk of developing Type 2 diabetes and insulin resistance in the future. Why do you think that is? Hint: Think about how the body adapts to its current condition.
This quick five-minute video below summarizes the relationships between glucagon, insulin, and glucose homeostasis. It does go slightly more in-depth than the level of the HK*2810 course, at 0:47, but it’s an excellent tool for encapsulating all of the material from this unit. This is an effective study tool to review what you have learned.
Key Takeaways
Consider the following concepts to help guide your studies:
- How insulin and glucagon are signalled to be secreted in the body.
- Understand the effects of insulin and glucagon on the liver, adipose tissue and skeletal muscle.
- Compare and contrast between the functions of insulin and glucagon.
- Understand how the body works to maintain blood glucose homeostasis.
Subchapter Quiz
The questions below can be used to assess your knowledge within this chapter. There are five multiple-choice questions that you should attempt without referring to your notes. The questions will provide you with responses to your answers to guide your studying but should not be used as your only resource.
Media Attributions
- Cellular Respiration © Darekk2 is licensed under a CC BY-SA (Attribution ShareAlike) license
- Anatomy of the Pancreas is licensed under a CC BY (Attribution) license
- Paracrine Regulation in Pancreas © Kaitlin Scherer is licensed under a CC BY (Attribution) license
- Insulin Regulation © Kaitlin Scherer is licensed under a CC BY (Attribution) license
- Glucagon Regulation © Kaitlin Scherer is licensed under a CC BY (Attribution) license
- Blood Glucose Regulation © Austin Community College is licensed under a CC BY (Attribution) license
- Glucose Regulation © Kaitlin Scherer is licensed under a CC BY (Attribution) license
- Metabolic Processes During the Absorptive State © OpenStax is licensed under a CC BY (Attribution) license
- Glucagon Response to Hypoglycaemia © Kaitlin Scherer is licensed under a CC BY (Attribution) license
- Metabolic Processes During Postabsorptive State © OpenStax is licensed under a CC BY (Attribution) license
- Regulation of Blood Glucose Concentrations © Austin Community College is licensed under a CC BY (Attribution) license
- Homeostatic Regulation of Blood Glucose Levels © Wade Hedegard is licensed under a CC BY (Attribution) license
- Hruby, V.J. (1997). Molecular and Cellular Endocrinology. Principles of Med Bio, 10, 387-401. https://doi.org/10.1016/S1569-2582(97)80161-4 ↵
- Heller, S. (2008). Sudden death and hypoglycemia. Diabetic Hypoglycemia, 1(2), 2-7. ↵
- Villines, Z. (2019). How insulin and glucagon regulate blood sugar. Medical News Today. ↵
- Betts, J.G., Young, K.A., Wise, J.A., Johnson, E., Poe, b., Kruse, D.H., Korol, O., Johnson, M.W., DeSaix, P. (2013). Carbohydrate Metabolism. Openstax. ↵
- Betts, J.G., Young, K.A., Wise, J.A., Johnson, E., Poe, b., Kruse, D.H., Korol, O., Johnson, M.W., DeSaix, P. (2013). Carbohydrate Metabolism. Openstax. ↵
- Betts, J.G., Young, K.A., Wise, J.A., Johnson, E., Poe, b., Kruse, D.H., Korol, O., Johnson, M.W., DeSaix, P. (2013). Carbohydrate Metabolism. Openstax. ↵
- John Hopkins Medicine. (n.d.) Pancreas Function ↵
- Betts, J.G., Young, K.A., Wise, J.A., Johnson, E., Poe, b., Kruse, D.H., Korol, O., Johnson, M.W., DeSaix, P. (2013). The Endocrine Pancreas. Openstax. ↵
- Betts, J.G., Young, K.A., Wise, J.A., Johnson, E., Poe, b., Kruse, D.H., Korol, O., Johnson, M.W., DeSaix, P. (2013). The Endocrine Pancreas. Openstax. ↵
- Modell, H., Cliff, W., Michael, J., McFarland, J., Wenderoth, M.P., Wright, A. (2015). A physiologist's view of homeostasis. Adv Physiol Educ, 39(4), 259-266. doi: 10.1152/advan.00107.2015. ↵
- Betts, J.G., Young, K.A., Wise, J.A., Johnson, E., Poe, b., Kruse, D.H., Korol, O., Johnson, M.W., DeSaix, P. (2013). The Endocrine Pancreas. Openstax. ↵
- Betts, J.G., Young, K.A., Wise, J.A., Johnson, E., Poe, b., Kruse, D.H., Korol, O., Johnson, M.W., DeSaix, P. (2013). The Endocrine Pancreas. Openstax. ↵
- Kate, T., Gauri, S., Jasuja, N., Juavinett, A.L., Altman, N. (n.d.) Parasympathetic vs. Sympathetic Nervous System. Diffen.com. ↵
- Kate, T., Gauri, S., Jasuja, N., Juavinett, A.L., Altman, N. (n.d.) Parasympathetic vs. Sympathetic Nervous System. Diffen.com. ↵
- Norman, J. (2016). Normal Regulation of Blood Glucose. Endocrineweb. ↵
- Norman, J. (2016). Normal Regulation of Blood Glucose. Endocrineweb. ↵
- Betts, J.G., Young, K.A., Wise, J.A., Johnson, E., Poe, b., Kruse, D.H., Korol, O., Johnson, M.W., DeSaix, P. (2013). The Endocrine Pancreas. Openstax. ↵
- Betts, J.G., Young, K.A., Wise, J.A., Johnson, E., Poe, b., Kruse, D.H., Korol, O., Johnson, M.W., DeSaix, P. (2013). The Endocrine Pancreas. Openstax. ↵
- Bowen, R. (2019). Physiologic Effects of Insulin. Vivo Pathophysiology. ↵
- Betts, J.G., Young, K.A., Wise, J.A., Johnson, E., Poe, b., Kruse, D.H., Korol, O., Johnson, M.W., DeSaix, P. (2013). The Endocrine Pancreas. Openstax. ↵
- Betts, J.G., Young, K.A., Wise, J.A., Johnson, E., Poe, b., Kruse, D.H., Korol, O., Johnson, M.W., DeSaix, P. (2013). The Endocrine Pancreas. Openstax. ↵
- Betts, J.G., Young, K.A., Wise, J.A., Johnson, E., Poe, b., Kruse, D.H., Korol, O., Johnson, M.W., DeSaix, P. (2013). The Endocrine Pancreas. Openstax. ↵
- Betts, J.G., Young, K.A., Wise, J.A., Johnson, E., Poe, b., Kruse, D.H., Korol, O., Johnson, M.W., DeSaix, P. (2013). The Endocrine Pancreas. Openstax. ↵
- Betts, J.G., Young, K.A., Wise, J.A., Johnson, E., Poe, b., Kruse, D.H., Korol, O., Johnson, M.W., DeSaix, P. (2013). Metabolic States of the Body. Openstax. ↵
- Betts, J.G., Young, K.A., Wise, J.A., Johnson, E., Poe, b., Kruse, D.H., Korol, O., Johnson, M.W., DeSaix, P. (2013). Metabolic States of the Body. Openstax. ↵
- Betts, J.G., Young, K.A., Wise, J.A., Johnson, E., Poe, b., Kruse, D.H., Korol, O., Johnson, M.W., DeSaix, P. (2013). The Endocrine Pancreas. Openstax. ↵
Low blood glucose.
The process of converting glucose into energy.
Synthesis of glycogen from glucose.
Synthesis of fatty-acids from non-lipid precursors.
The process by which glycogen is broken-down into glucose.
Breakdown of fats by hydrolysis to release fatty acids.
The process of making glucose from non-carbohydrate carbon substrates, including lactate, glycerol and amino acid.
A form of cellular signalling in which cells that are near one another communicate through the release of chemical messengers, allowing cells to locally coordinate their activities.
A variable that is being sensed and maintained by a homeostatic system.
Elevated blood glucose.
A pancreatic islet cell type that produces the hormone glucagon.
Modification or control of a process using its anticipated results or effects.
Prepares the body to respond to stress, such as a threat or injury. It is often referred to as the “fight-or-flight” response.
Pancreatic islet cell type that produces the hormone insulin.
The period during digestion when anabolism exceeds catabolism.
Metabolic state achieved after complete digestion and absorption of a meal.
A state of relatively stable equilibrium in the body that is maintained by constant adjustment of biochemical and physiological pathways.
