Ventilation Perfusion Ratio
Is there such thing as a ratio of blood gas to blood flow? Does it have an optimal level? Throughout this section, various real-life scenarios will be investigated, and this optimal ratio will be discussed. This chapter focuses on the ventilation-perfusion ratio (VA/Q), in which we examine the importance of maintaining adequate air and blood flow to maintain normal blood gas levels. A firm grasp on previously discussed ventilation and pulmonary circulation topics will help you excel with the content to come, as it is now time to apply that knowledge.
Learning Outcomes
In this section you will learn…
- Provide an explanation as to why the ratio between ventilation and perfusion is important.
- Identify real-life scenarios that would lead to changes in PAO2 and/or PACO2.
- Explain why PAO2 values are not the same as atmospheric PO2 values.
VA/Q Ratio
Alveolar ventilation (VA) is the amount of gas going into the alveoli as a volume, while perfusion (Q) is the amount of blood flow to the alveoli. The optimal VA/Q ratio is 1.0, whereby ventilation and perfusion match, meaning that there is sufficient airflow in proximity to blood. A ratio above or below 1.0 is considered VA/Q mismatch, as it is not ideal for physiological function. Understanding this ratio is crucially important as it pertains to the blood gas levels of carbon dioxide and oxygen at the level of the alveoli. The concentration of blood gases serves as a means to regulate respiration.
The following video is included as a resource to help students understand why the ventilation and perfusion ratio changes across the lung regions. Within the first 5 minutes of this video, ventilation and perfusion are both defined and expressed within their VA/Q ratio. The video then transitions into an explanation of why perfusion differs across different regions in the lungs as well as the role of gravity within this distribution. This information can be found from 5:15 – 7:40. The remainder of the video examines different diseased states to practice applying the VA/Q ratio. Examples include pneumonia, COPD, and pulmonary edema.
Did you know a giraffe’s lung can be up to 1 meter in height and 0.7 meters wide? It was thought that giraffes might experience VA/Q mismatch due to the sheer size of their lungs and the effect of gravity. It was believed that the gravitational forces could lead to hypoxemia. However, it was found that their VA/Q ratio is similar to that seen in humans and small animals! [1]
Test Your Knowledge
Real-Life Scenario:
You are feeling really nervous before going in to write your physiology final. You have managed to keep your breathing under control but your heart is beating what feels like a thousand times per minute. You are experiencing an increase in heart rate and contractility, thus leading to an increase in cardiac output. Will your PAO2 and PACO2 increase or decrease as a result of increased flow? Hint: Increase in cardiac output means that more blood is interacting with your alveoli.
Perfusion
The lungs can be sectioned off into three different zones concerning how they handle perfusion. The top of the lung experiences the lowest perfusion, leading to a decrease in flow (Q) from the intense gravitational influence causing alveolar distention. The middle of the lung undergoes an average amount of perfusion and ventilation, allowing for a VA/Q ratio equal to 1. Finally, the bottom of the lung experiences the highest perfusion, increasing flow (Q) because the alveoli are experiencing the least distention from gravity, thus creating a more significant ventilation opportunity.
Within these three sectors of the lungs, we can see differing VA/Q ratios, due to the relationship between perfusion and ventilation.
At the top of the lung = VA/Q ratio is increased
At the middle of the lung= VA/Q = 1
At the bottom of the lung = VA/Q ratio is decreased
Test Your Knowledge
Real-Life Scenario:
You and a group of friends are playing Chubby Bunny. The aim of the game is to fit as many marshmallows as possible in your mouth and still be able to say the phrase ‘chubby bunny’. Your one friend is a little too competitive and ends up choking on a marshmallow, completely blocking their airway. Will PAO2 and PACO2 increase or decrease as a result of airway obstruction? Explain your answer. Hint: Is the VA/Q ratio increasing, decreasing or staying in equilibrium.
This video discusses the differences between perfusion and ventilation rates across the lung. This alternative video is similar to the one above but dives deeper into why we have varying perfusion and ventilation rates across the lung. An alternative explanation of the VA/Q ratio can be found at the timestamp of 0:26-2:03. The reasons why ventilation and perfusion are more substantial at the lung base are outlined from 2:05-5: 17. The video ends in additional disease state examples that allow for a practical application of the ventilation-perfusion ratio.
“Everything you Need to Know About the Ventilation Perfusion Ratio” by Medmastery is all rights reserved.
Connecting Ventilation and Perfusion to Blood Gases in the Alveolar Space
We have seen how important the VA/Q ratio is at predicting flow and perfusion rates, but now we need to apply this knowledge to predict blood gas levels in the alveoli.
Ventilation (VA) will add oxygen and remove carbon dioxide from the alveoli, resulting in increased partial pressure of alveolar oxygen (PAO2). While perfusion (Q) will add carbon dioxide and remove oxygen from the alveoli, resulting in increased partial pressure of alveolar carbon dioxide (PACO2).
Test Your Knowledge
Clinical Application:
You know somebody who has bradycardia, a condition characterized by a resting heart rate of fewer than 60 beats per minute. This decrease in heart rate causes a decrease in cardiac output, meaning less blood is passing through the lungs. Will PAO2 and PACO2 increase or decrease as a result of decreased perfusion? Explain your answer. Hint: The graph above is a great way to visualize your options.
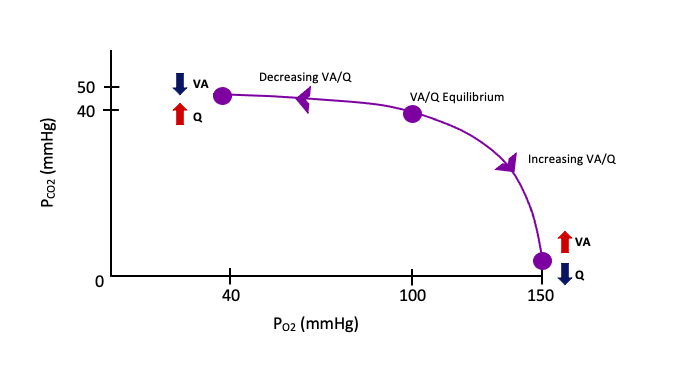
In this regard, there are two possible scenarios that can lead to alterations in ventilation and flow. First, it is important to mention that when our VA/Q ratio is in equilibrium there is no alteration in oxygen or carbon dioxide pressure. They both stay at their respected 100mmHg and 40mmHg. However, when we alter ventilation, for example by choking due to something obstructing our airway, we decrease the amount of oxygen entering and carbon dioxide leaving the alveolar space. In figure 1 below, you can see that by decreasing ventilation, we travel from the equilibrium position towards the graph’s left side. This lack of ventilation but normal flow leads to increased PACO2 and a decrease in PAO2. In contrast, if we were hyperventilating we would be increasing ventilation and decreasing flow, as our heart would not pump fast enough to match the accelerated breathing rate. This causes us to travel from equilibrium in figure 1 to the right side of the graph. The increase in ventilation but a decrease in flow would be adding more oxygen to the system, increasing PAO2, but the rate at which we remove carbon dioxide would also increase, leading to a reduction in PACO2.
Tips From Past Students
These relationships may seem easy to memorize, but the key here is to understand them. Be able to flip each variable from increasing to decreasing and think about the effects it will have on other variables in the relationship. For example, take a few minutes to write down what the effects of decreasing ventilation will have on the VA/Q ratio, will it increase, decrease or be equal to 1? As well as the levels of PAO2 and PACO2, will each increase or decrease?
Identifying VA/Q ratios
Being able to identify and explain where in the lung the ratio differs as well as why is important for this topic. Use the activity below to check your understanding of how ventilation and perfusion differ across the lung. Each image and corresponding level of the lung belong in one box each.
Partial Pressures
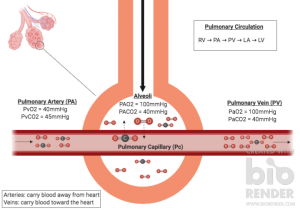
The VA/Q relationship is essential for predicting alveolar and arterial partial pressures of oxygen and carbon dioxide. Later in this unit, you will learn more about the role of PO2 and PCO2 in controlling respiration and the receptors that detect these gases. For now, we will focus on the anticipated partial pressures of both oxygen and carbon dioxide in the atmosphere, alveoli, arterial blood, and venous blood (Figure 2). The atmospheric pressure at sea level is 760 mmHg, with 20.9% being composed of oxygen. This gives oxygen partial pressure of approximately 160 mmHg. In comparison, carbon dioxide makes up around 0.03% of the atmospheric air, which provides a partial pressure of nearly 0 mmHg.
So why is PAO2 less than the atmospheric 160 mmHg and PACO2 greater than 0? It has to do with four physiological factors. Firstly, we need to think about the flow of oxygen. Within the pulmonary system, oxygen is constantly being removed from the alveoli, and carbon dioxide is continually being added, creating a gas exchange pressure gradient within this environment. Hydration is also a key factor when making this pressure difference. When air is brought into the respiratory tract through the nose and mouth, this air is dehydrated and not an optimal body temperature to gain full entry into our systems. The inspired air has to be warmed to 37˚C and saturated with water within the bronchi to obtain this access key.
Another essential physiological aspect to consider is residual volume. Following expiration, there is always air left in the lungs to prevent the collapse of alveoli. When we inhale again, the inspired air is mixed with the previously equilibrated air. The final factor that contributes to this pressure difference is dead space. About 150 mL of air rests within the trachea following expiration. This air has already been equilibrated at the lungs and therefore has a higher PCO2 and lower PO2 than the atmospheric air inspired. Overall, these four key factors are always present when breathing and ultimately lead to a difference between atmospheric air and air pressure within the alveoli.
Test Your Knowledge
Thinking Beyond:
The concentration gradients drive gas exchange at the lung. Oxygen has a sufficient concentration gradient with a difference of 60 mmHg, between the blood (PvO2= 40 mmHg) and the alveoli (PAO2= 100 mmHg), to draw oxygen into the blood. However, the concentration gradient for carbon dioxide at the lung is only 5 mmHg between the blood (PvCO2= 45 mmHg) and the alveoli (PACO2= 40 mmHg). So how is carbon dioxide able to experience gas exchange with such a low difference in PCO2? Hint: Remember Fick’s Law : [latex]Volume_{(g)}=\frac{Area}{Thickness}*D*(P_1 − P_2)[/latex]. Meaning that gas diffusion is mediated by lung properties (area and thickness), properties of the gas, and the concentration gradient.
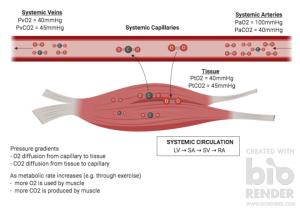
It is important and helpful to know that the PO2 and PCO2 values in the tissue, systemic venous, and arterial blood occurs in the reverse sense in comparison to at the alveoli, as shown in figure 3. Note that the partial pressures listed at the alveoli are post-equilibrated values. The blood always spends enough time at the alveoli to equilibrate, and as such the values at the alveoli can serve as a prediction of arterial partial pressures prior to reaching the tissue.
Key Takeaways
Consider the following concepts to help guide your studies:
- The ventilation and perfusion ratio help predict blood flow and gas exchange across the lungs’ various zones.
- A VA/Q ratio below or above one is considered a mismatch and will impact PACO2 and PAO2.
- The VA/Q ratio graph is a great way to start every real-life scenario, as it allows you to visualize how PACO2 and PAO2 will be impacted.
- When atmospheric air enters the respiratory tract, flow, residual volume, dead space, and hydration create a micro-climate that contributes to a pressure change.
Subchapter Quiz
The questions below have been created to assess your knowledge within this subchapter. You will find multiple-choice questions as well as open-ended questions to test your understanding. The multiple-choice questions will provide you with responses to your answers. However, the open-ended questions will be for you to judge, so be sure to check over your answers to see if you are missing any critical points after you’ve completed them.
Media Attributions
- Ventilation-flow ratio graph © Allanna MacKenzie is licensed under a CC BY-ND (Attribution NoDerivatives) license
- Pulmonary Gas Exchange © Robert King is licensed under a CC BY (Attribution) license
- Skeletal Gas Exchange © Robert King is licensed under a CC BY (Attribution) license
- Nyman, G., Roken, B., Hedin, E., & Hedenstierna, G. (2016). Case studies in physiology: ventilation and perfusion in a giraffe- does size matter?. Journal of Applied Physiology, 121(6), 1374-1378. ↵
The exchange of gas between the alveoli and the atmosphere.
The amount of blood flow to the alveoli.
Lung inflammation caused by bacterial or viral infection, in which the air sacs fill with pus and may become solid.
Constriction of the airways that interferes with normal breathing.
Abnormal buildup of fluid in the lungs.
Abnormally low concentration of oxygen in the blood.
Rapid and deep breathing.
The delivery of oxygen from the inhaled air in the lungs into the blood and the removal of carbon dioxide from the blood into the exhaled air in the lungs.
The amount of air remaining in the lungs after normal tidal expiration.
