The Pressure-Volume Relationship and Cardiac Output
You know that each cardiac cycle consists of a period of filling followed by a contraction period, where blood is ejected out of the heart and into circulation. However, have you ever considered how blood is moved throughout the chambers of the heart and sent out to the body? This chapter will investigate how the heart relies on pressure differences to facilitate blood flow from one chamber to the next. In each cardiac cycle of the heart, a series of phases are characterized by pressure-volume relationships, functioning to push blood throughout the heart and into the systemic circulation. This chapter will also consider the significance of this relationship to cardiac output (CO) and the heart’s ability to pump blood out to the body.
Learning Outcomes
In this section you will learn…
- The pressure-volume loop of a cardiac cycle in relation to its phases.
- To define and orient the different cardiovascular measures within the cardiac cycle.
- The importance of EDV (end-diastolic volume), preload, ESV (end-systolic volume), and afterload.
- The CO equation and how it is influenced by the above variables.
Introduction to the Pressure-Volume Relationship of the Cardiac Cycle
The Graphical Illustrations of the Pressure-Volume Relationship
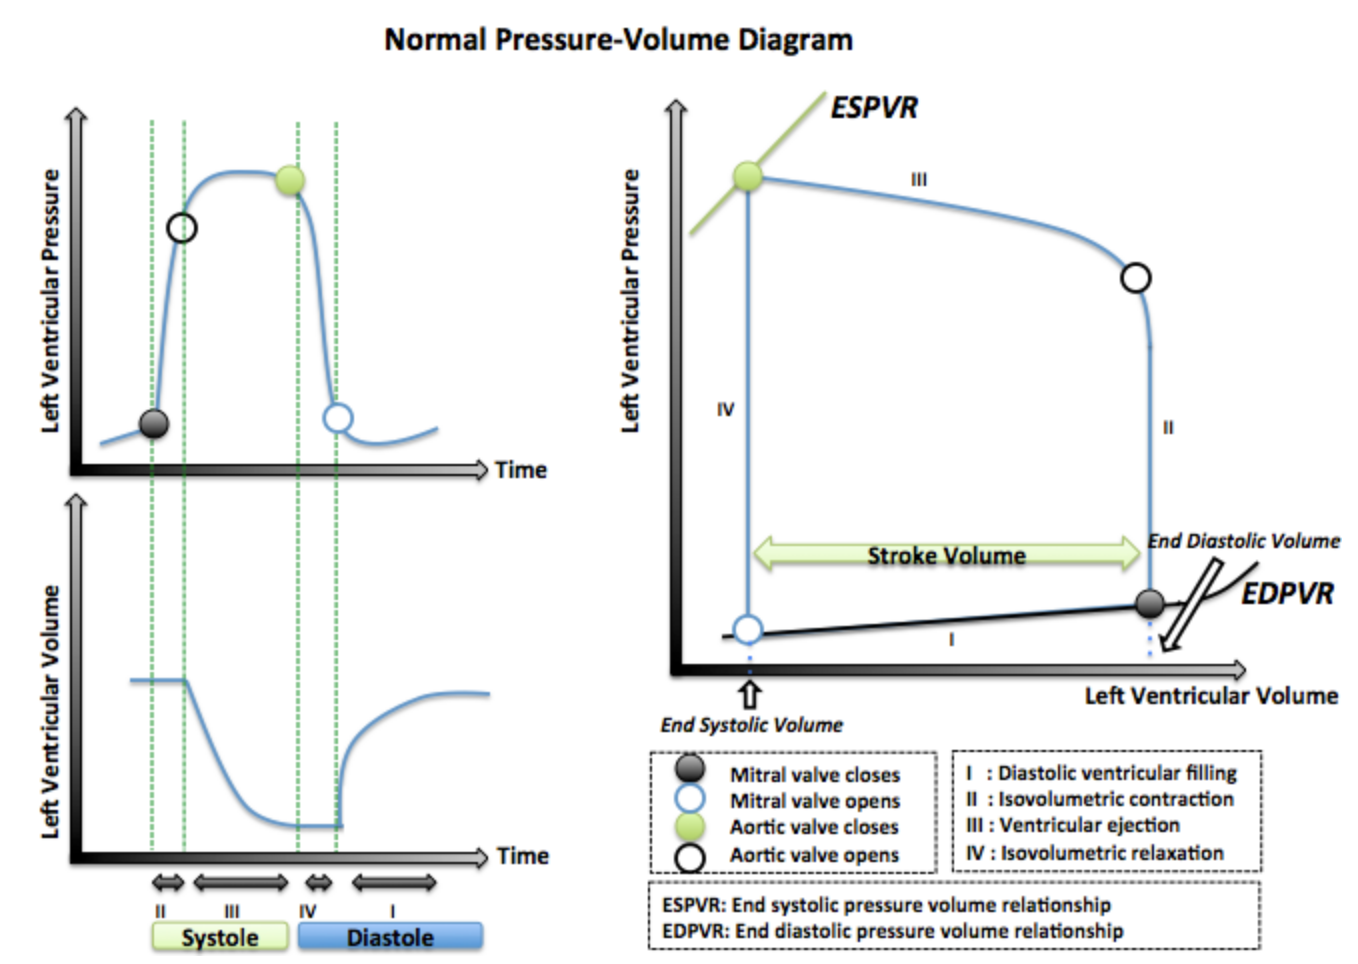
The pressure-volume relationship compares the pressure and volume changes in the heart’s left ventricle with every heartbeat. This relationship can be demonstrated through two commonly used graphical representations; a comparison of left ventricular pressure and volume over time or the pressure-volume loop. Both of these illustrations can be quite complicated for students beginning their study of heart physiology. However, after practicing proper interpretation of these graphs, you will see they can be beneficial as they summarize the blood flow through the heart in the cardiac cycle’s various stages. The two variations of the pressure-volume graphs are presented below. Try to orient yourself to the graphs to identify the key stages of the cardiac cycle.
Tips From Past Students
Don’t be afraid to look up words that you think you should know, but aren’t certain about. Reading through the glossary can be very helpful to preface a chapter.
- Iso-volumetric: No change in volume despite large increase/decrease in pressure. We see this as pressure builds in the ventricles in preparation for systolic contraction.
Drawing the Pressure-Volume Loop Video
To support your understanding of the pressure-volume diagrams, the following video explains how to orient yourself to each of the graphs. The video will demonstrate how the two graphical variations can combine to form the cardiac cycle’s true pressure-volume “loop.” The beginning of the video will discuss the variation with separated pressure and volume over time. Skip ahead to 4:00 for the discussion of the pressure-volume loop variation. Note that this learning object is above the level of knowledge required for HK*3810.
Tips From Past Students
Some professors will use both variations of this graph in their lectures, and a lot of students stick to memorizing one of them. However, if you are able to translate one version into the other you will know that you have truly mastered the pressure-volume relationship. Here are some different ways you can practice:
- Flip a coin to decide which graph to draw. Draw it, then draw the other variation and compare.
- Draw whichever graph is easier for you to understand, then “grade” it as if you were a TA by comparing it to the one in your notes. Did you miss anything important?
- Find a friend who is not in the course and explain a graph of your choice. How did the graph that you drew facilitate your explanation of the pressure-volume loop?
Varying your approach to learning these graphs will make studying more fun. Not only that but each new approach that you try will give you a new perspective about the material!
Understanding the Pressure-Volume Loop Video
The last video on this topic did an excellent job at outlining the pressure-volume relationship and drew out a good ‘skeleton’ for the graphs. This video fills in all the missing information needed to understand why the pressure-volume loop is essential to the cardiac cycle. Since it’s less than 10 minutes long, we would recommend watching it all the way through, as it addresses some of the most fundamental concepts relating to this section.
Phases of the Pressure-Volume Loop
As discussed above, the pressure-volume loop is a useful tool to visualize the pressure and volume relationship of the heart through a cardiac cycle. When viewed in its entirety, the loop demonstrates the relationship during a single cardiac cycle; however, we can break this cycle down into several key phases: diastole, iso-volumetric contraction, systole, and iso-volumetric relaxation. Each of these phases of the cycle presents a unique pressure-volume relationship that contributes to the heart’s efficiency when occurring in proper order. A few of the key characteristics of these phases will be described below.
End Diastolic Volume (EDV) or Preload
Diastole is the phase of the cardiac cycle in which the heart muscles are relaxed, allowing for blood flow into the chambers. The volume of blood located in the left ventricle at the end of diastolic filling is referred to asEnd diastolic volume (Preload) (EDV). Preload is often used interchangeably with EDV, as it is defined by the stretch of the ventricles following diastole. Both terms refer to the pressure-volume relationship of the heart after it has completed filling and before it begins contraction.
The following video defines preload very differently than you will likely learn in class. The narrator takes on a more physics approach to the definition, which may make the concept click for more mathematically inclined students. Skip ahead to 5:50 if you are short on time, here the narrator specifically starts to define preload. Note that this learning object is above the level of knowledge required for HK*3810. It describes preload well, but also goes on and explains some extra information not explained in class.
End Systolic Volume (ESV)
Systole is the phase of the cardiac cycle in which the cardiac myocytes cause contraction of the heart, and blood is ejected from the left ventricle into circulation. End systolic volume (ESV) is the amount of blood left in the ventricle after the ejection.
Tips From Past Students
I found the tea cup analogy to be useful when learning about preload and ESV. As you passively fill the cup with tea, the volume (now in the cup), becomes your preload. Now imagine you take a big sip of tea. You drink almost all of the tea that was in the cup. In terms of our analogy, the small volume left in the cup can be referred to as the ESV.
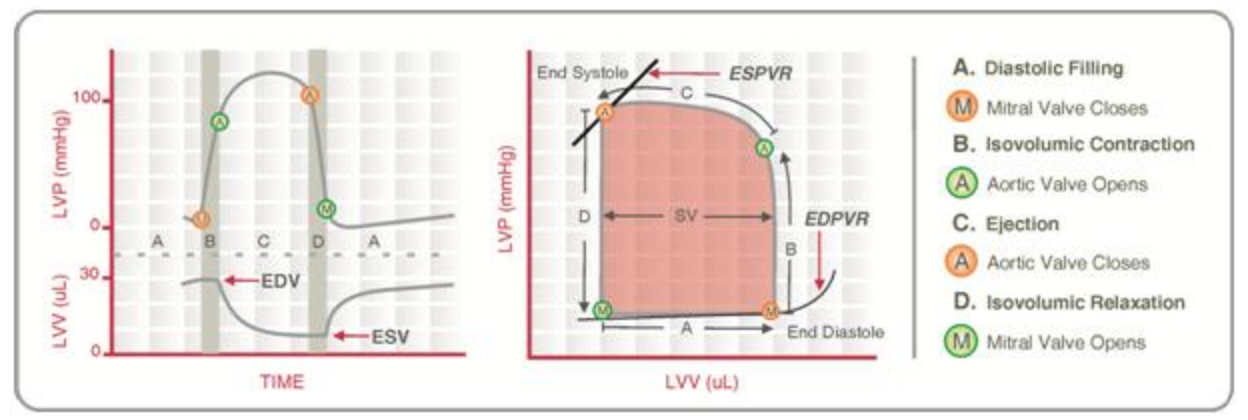
EDV and ESV within the Pressure-Volume Loop
Now that you have learned about EDV and ESV, consider the following figure. These graphs are the same as the graphs presented in figure 1 of this chapter, however, they include the representation of EDV and ESV within the relationships. Notice the difference in blood volumes between EDV and ESV displayed through both illustrations. A tip for quick orientating yourself is to locate where left ventricle volume is highest to find EDV and where blood volume is the lowest to find ESV.
Test Your Knowledge
Real-Life Scenario:
When you stand upright, gravity pulls your blood into your lower extremities. This can decrease venous blood pressure. How would this affect the pressure and volume in the left atrium? What about the left ventricle? How would this affect the pressure and volume in the right atrium and ventricle? What about preload? For more information on the factors that influence preload visit this Cardiovascular Physiology Concepts. Hint: Think about the pathway of blood throughout the circulatory system and it’s return to the heart. Using this knowledge, visualize the impact on the heart if gravity was pulling blood away from the trunk and towards the legs, opposing the normal flow of blood.
Afterload
Since blood flow throughout the heart relies on the use of a pressure gradient, the pressure within the left ventricle needs to surpass the pressure in the aorta in order for blood to leave the heart. When the left ventricle can generate high enough pressures, the aortic valve will open and permit blood flow from the ventricle to the aorta and out to the tissues. The pressure located in the aorta that the ventricle must overcome to eject the blood volume is referred to as afterload.
The following video provides a strong explanation of the concept of afterload. Similar to the preload video, the narrator takes a physics-based approach to the definition of afterload. The video also offers an excellent summary of everything we have learned in this chapter: pressure-volume loop, cardiac cycle, and preload. Keep in mind that you do not have to memorize any of these equations. They are just used by the video to help contextualize the material.
End Systolic Volume vs. Afterload
When beginning their studies in Cardiovascular physiology, many students make the mistake of assuming that ESV and afterload are interchangeable terms similar to EDV and preload. It is crucial to distinguish between ESV and afterload while still recognizing how they influence each other.
ESV is the measure of blood volume found within the left ventricle following systole. Afterload is the measure of blood pressure in the aorta that the pressure in the left ventricle must overcome to eject blood into circulation. If afterload increases, the left ventricle will need to spend more time building pressure to overcome this increased pressure in the aorta. This results in less blood being ejected from the ventricle in systole, therefore a greater ESV. In opposition, if afterload decreases, the left ventricle will not need to generate as much pressure to overcome that of the aorta. This results in more blood being ejected during systole and a lower ESV.
Test Your Knowledge
Clinical Application:
Aortic Stenosis is a very severe valve disease that is characterized by a narrowing in the aortic valve. This narrowing provides increased resistance to the blood flowing from the left ventricle to the aorta. [2] How would this increased resistance affect afterload? Use your understanding of afterload to explain how this disease may impact stroke volume (SV) and CO. How would you expect the pressure-volume loop to change for patients suffering from aortic stenosis compared to a healthy individual? Consider the valvular stenosis were to occur in the mitral valve rather than the aortic valve. What potential effects could this have on SV and CO? Hint: Recall the valve located between the chambers of the heart.
To learn more about Aortic Stenosis see this Cardiovascular Physiology Concepts – Heart Disease.
Cardiac Output
It would be unfair to start explaining CO without first introducing SV. Think of SV as the product of the relationship between EDV and ESV. Therefore, SV is the volume of blood pumped from the left ventricle with each beat of the heart. SV and (EDV – ESV) can be used interchangeably in the CO equation.
[latex]SV=EDV-ESV[/latex]
In addition to SV, CO is also influenced by heart rate (HR), which refers to the number of heartbeats per minute. Therefore, CO is defined as the volume of blood pumped per minute.
This section looks at cardiac output which describes the flow of blood throughout the body each minute, it’s recorded as litre/minute (L/min) and sometimes denoted at Q. You will be expected to apply two key relationships to this variable:
[latex]Q=\frac{P_1−P_2}{R}[/latex]
[latex]CO=SV*HR[/latex]
The first equation will be explored in the vasculature section, so don’t worry about it right now.
Test Your Knowledge
Clinical Application:
A certain class of drug called calcium entry blockers prevents Ca2+ from entering the myocardium. [3] In isolated cardiac myocytes, contractility is observed to decrease. Explain why this makes sense. How could this affect CO? Support your ideas using one or more of the equations above. Hint: Recall from HK*2810 the importance of Ca2+ in myocyte contractions.
If you would like to learn more about a memorable analogy relating CO and its determinants to cycling, read Understanding cardiac output.
Factors Affecting Cardiac Output
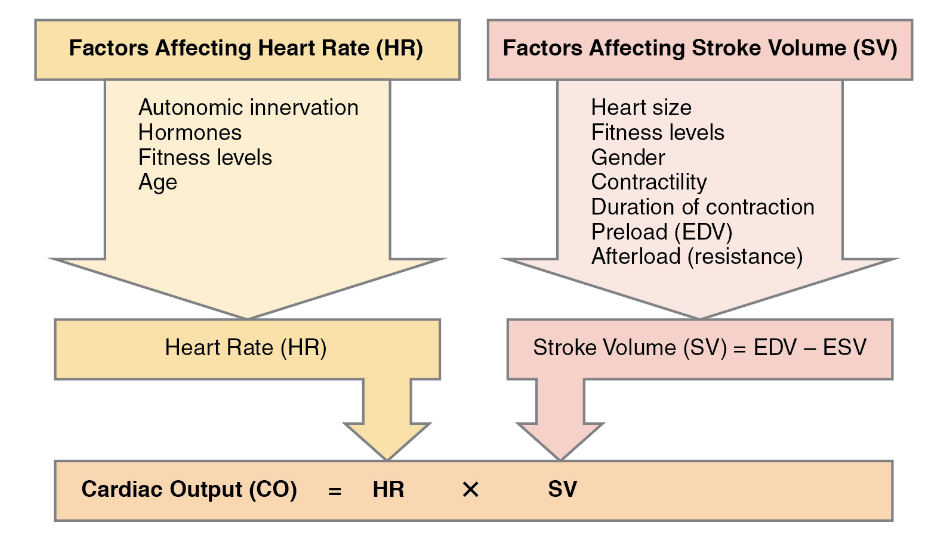
CO is a function of HR and SV. Due to this relationship, the various factors influencing HR and SV will influence CO. The following flow chart outlines several factors that affect either HR or SV and how we can infer their resulting impact on CO through the cardiac output equation.
Ensure you have a strong understanding of this flow chart because it will be the basis for many term test questions. Notice that some factors contribute to variation between individuals, while some can contribute to variation within an individual.
Test Your Knowledge
Thinking Beyond:
A healthy heart presents the unique capacity to respond to certain stresses through structural adaptations. For example, heart adaptations occur in response to endurance training. Long-term endurance training increases CO and the amount of blood returning to the heart. To compensate for the increased blood volume, the left ventricle enlarges it’s chamber size. [4] How would this adaptation affect end-diastolic volume/ pre-load?Explain why you think this structural adaptation is beneficial for cardiac function in endurance athletes? Hint: Larger chamber size means the left ventricle has expanded its available filling dimensions.
If you want to learn more about how the heart responds to exercise read Cardiac remodeling and endurance exercise.
If this clinical example interests you, maybe a career as a Physiological Scientist specializing in Exercise Physiology would too?
Key Takeaways
Consider the following concepts to help guide your studies:
- Blood flow throughout the heart each cardiac cycle presents a complex pressure-volume relationship. This relationship is comprised of various stages such as; diastole, isovolumetric contraction, systole, and isovolumetric relaxation.
- EDV represents the blood volume found in the left ventricle after diastole, where the heart undergoes relaxation and passively fills the ventricle. EDV is used interchangeably with the term preload, which refers to the stretch of the ventricle after it is filled in diastole.
- ESV is the measure of the blood volume that remains in the left ventricle after systole, where the blood is ejected from the heart into circulation.
- Afterload is a measure of the pressure present in the aorta that the left ventricle must overcome to open the aortic valve and eject the blood from the heart.
- CO is the measure of blood pumped by the heart every minute. CO is dependent on HR and SV; [latex]CO = HR x SV[/latex].
- Various factors influence CO. Since it is dependent on HR and SV, anything that alters these values will, in turn, alter CO.
Subchapter Quiz
The questions below can be used to assess your knowledge within this chapter. There are five multiple-choice questions that you should attempt without referring to your notes. The questions will provide you with responses to your answers to guide your studying but should not be used as your only resource.
Media Attributions
- Normal Pressure-Volume Diagram © Rim Halaby is licensed under a CC BY (Attribution) license
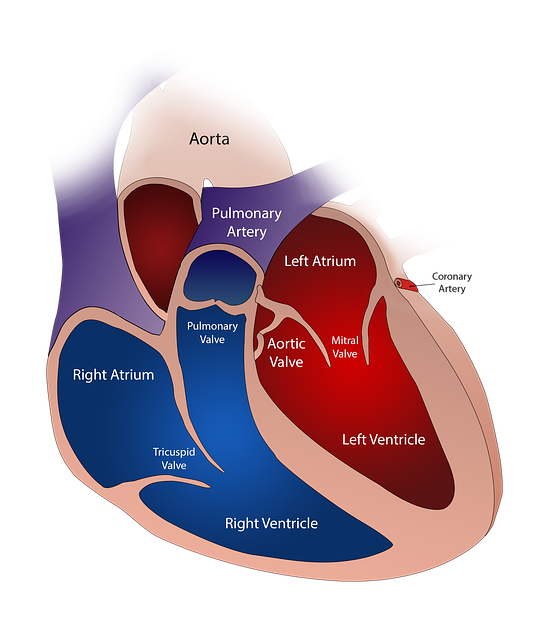
- Structure of the Heart © burlesonmatthew is licensed under a CC0 (Creative Commons Zero) license
- Cardiac Pressure Volume Loop © Andyhenton83 is licensed under a CC BY-SA (Attribution ShareAlike) license
- Major Factors Influencing Cardiac Output © J. Gordon Betts, Kelly A. Young, James A. Wise, Eddie Johnson, Brandon Poe, Dean H. Kruse, Oksana Korol, Jody E. Johnson, Mark Womble, Peter DeSaix is licensed under a CC BY (Attribution) license
- Left Ventricle. (n.d.). https://www.liverpool.ac.uk/~trh/local_html/heartdisease/left_ventricle.htm. ↵
- Carità, P., Coppola, G., Novo, G., Caccamo, G., Guglielmo, M., Balasus, F., Novo, S., Castrovinci, S., Moscarelli, M., Fattouch, K., & Corrado, E. (2016). Aortic stenosis: insights on pathogenesis and clinical implications. Journal of geriatric cardiology: JGC, 13(6), 489–498. https://doi.org/10.11909/j.issn.1671-5411.2016.06.001 ↵
- Vincent J. L. (2008). Understanding cardiac output. Critical care (London, England), 12(4), 174. https://doi.org/10.1186/cc6975 ↵
- Mihl, C., Dassen, W. R., & Kuipers, H. (2008). Cardiac remodelling: concentric versus eccentric hypertrophy in strength and endurance athletes. Netherlands heart journal: monthly journal of the Netherlands Society of Cardiology and the Netherlands Heart Foundation, 16(4), 129–133. https://doi.org/10.1007/BF03086131 ↵
The volume of blood in the ventricles following passive diastolic filling (high volume). Also referred to as preload.
The volume of blood in the ventricles that is “left over” following contraction (low volume).
The opposing pressure inside the aorta that keeps the aortic valve closed and works against the ejection of blood volume from the left ventricle.
The amount of blood pumped through the circulatory system in 1 minute (L/min).
