Sensors
Imagine you are going for a hike in the woods with your friend. Along this hike, you see something out of the corner of your eye, and it appears to look a whole lot like… A BEAR! Your central control kicks in immediately, causing a cascade that leads to elevated blood pressure. However, upon a clearer look, you realize it was just a bush, and your blood pressure decreases. A situation like this showcases the body’s ability to sense changes in mean arterial pressure (MAP) and initiate the proper mechanisms to restore homeostatic conditions. This chapter will describe the sensors responsible for monitoring blood pressure, how they relay information regarding deviations in blood pressure, and how the body integrates this sensory information into processes that attempt to restore homeostasis.
Learning Outcomes
In this section you will learn…
- The importance of cardiac regulation and the importance of MAP as a regulated variable.
- What detects deviations in MAP and how these detectors make the brain aware of the pressure abnormalities.
- How the body begins cascades to correct these problems.
MAP refers to the average arterial pressure in one complete cardiac cycle. The volume of blood ejected from the left ventricle per minute, and the resistance applied to this blood flow must be known in order to determine MAP. Therefore MAP is the product of cardiac output (CO) and total peripheral resistance (TPR). CO refers to the blood entering the arterials from the heart, whereas TPR refers to the resistance blood faces when exiting the arterials. Due to this relationship, any alterations in CO or TPR will have a resulting impact on MAP.
[latex]MAP = CO * TPR[/latex]
Tips From Past Students
Understanding the concept and calculations of MAP can be pretty challenging as it requires the integration of knowledge from other subchapters of the Heart and Vasculature unit. When answering questions requiring the estimation of MAP, try splitting the information into two categories; blood flow into the compartment and blood flow out of the compartment.
- Blood flow into the compartment is determined by CO. Recall, CO is the product of heart rate (HR) and SV (stroke volume). Therefore, CO increases when HR and/or SV increase, and as a result, more blood will flow into the arteries. In contrast, if HR and/or SV decrease, CO and blood flow into the arteries will also decrease.
- Blood flow out of the compartment is determined by TPR. Recall, TPR may be altered through vasoconstriction or vasodilation of the resistance arterioles. Vasoconstriction allows blood flow out of the arteries, while vasodilation restricts blood flow out of the arteries.
Separately considering the CO and TPR influences will provide information on the blood flow into and out of the compartment and will help you understand the resulting volume within the arteries to determine MAP.
Baroreceptors
MAP is an important variable for the body, as it refers to the average pressure present in the arteries during each cardiac cycle. Any substantial fluctuations of MAP outside of it’s homeostatic ranges can cause harmful effects to the system. If MAP becomes too high, it can cause damage to the functioning of the heart. If it becomes too low, adequate blood supply may not reach the body tissues. Normal levels are typically considered to be within 70-100 millimeters of mercury (mmHg) [1]. Since MAP is so critical, it is a regulated variable. This means the body has sensors and restoration mechanisms that respond to fluctuations in MAP. Some examples of these sensors are the chemoreceptors and the high-pressure baroreceptors. The arterial chemoreceptors react to variations in O2 (oxygen), CO2 (carbon dioxide), H+(hydrogen ion), and lactic acid levels in the blood. In contrast, the baroreceptors respond to variations in stretch caused by the blood flow through the compartment. When these sensors detect changes beyond homeostatic ranges, they will alter their action potential firing pattern, which signals to the brain in central control that blood pressure is abnormal. As a result, the brain will initiate the necessary cascades to restore normal levels. The relationship between the sensors, central control, and effectors is another example of the sensor-control-effector triad you have likely seen applied to various other concepts throughout your studies in Human Physiology.
Tips From Past Students
The most important regulated variable in the body is blood pressure. It is important to understand that every single change or “decision” the cardiovascular system makes is in order to restore blood pressure homeostasis or regulate it within a very small range.
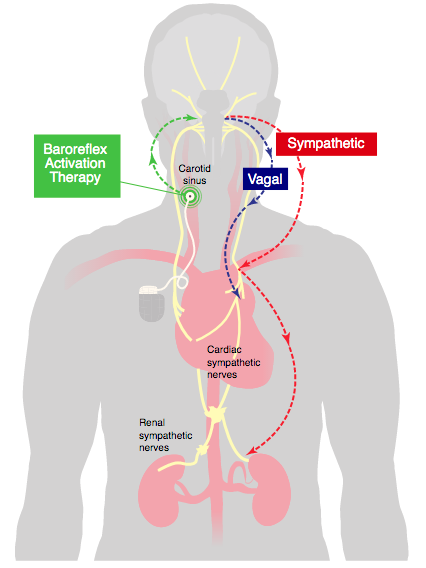
Baroreceptor Location Diagram
The picture below presents the sensor-central control-effector triad relationship. The picture illustrates the communication between one of the two baroreceptor locations (Carotid Sinus), the brain, and the Sympathetic Nervous System (SNS). From this image, you can visualize the restoration pathways that respond to an increase or decrease in MAP. The baroreceptor sensors will sense an increase or decrease in MAP in the Carotid Sinus and Aortic Arch. These sensors will send signals to the brain indicating levels have fluctuated out of homeostatic range. The brain interprets this information and initiates the proper restoration cascade by coupling the activation and inhibition of the SNS and PNS (Parasympathetic Nervous Systems).
Test Your Knowledge
Real-Life Scenario:
Since MAP is a regulated variable, the body has sensors to detect changes in it. What are the names and the locations of these sensors that detect an increase or decrease in MAP? How do these receptors measure an increase in MAP? How do these receptors measure a decrease in MAP? Explain why their locations are advantageous for monitoring MAP, instead of being located elsewhere in the circulatory system. Hint: If you are having difficulty with this question, refer to the above figure to refresh your memory on the properties of the sensors.
Baroreceptor Video
The video below provides a helpful refresher on the concept of homeostasis. It is essential to understand the significance of homeostasis in the body and how MAP regulation contributes to maintaining this state of homeostasis. At 4:00 the video begins to discuss baroreceptors and their importance to blood pressure regulation. This video is a great summary of this section and provides lots of useful contexts.
Blood Pressure
The following charts describe the cardiovascular response to extreme increases and decreases in blood pressure. The charts compare the characteristics of the chemoreceptors and baroreceptors as they respond to fluctuations. The arterial chemoreceptors will respond to blood O2, CO2, H+, and lactic acid, whereas the baroreceptors will respond to compartmental stretch. The two receptors also cause opposite effects on the PNS and SNS branches of the Autonomic Nervous System depending on whether blood pressure is increased or decreased. Although both types of receptors function through different mechanisms, they both work to achieve the same overall goal of restoring normal blood pressure levels.
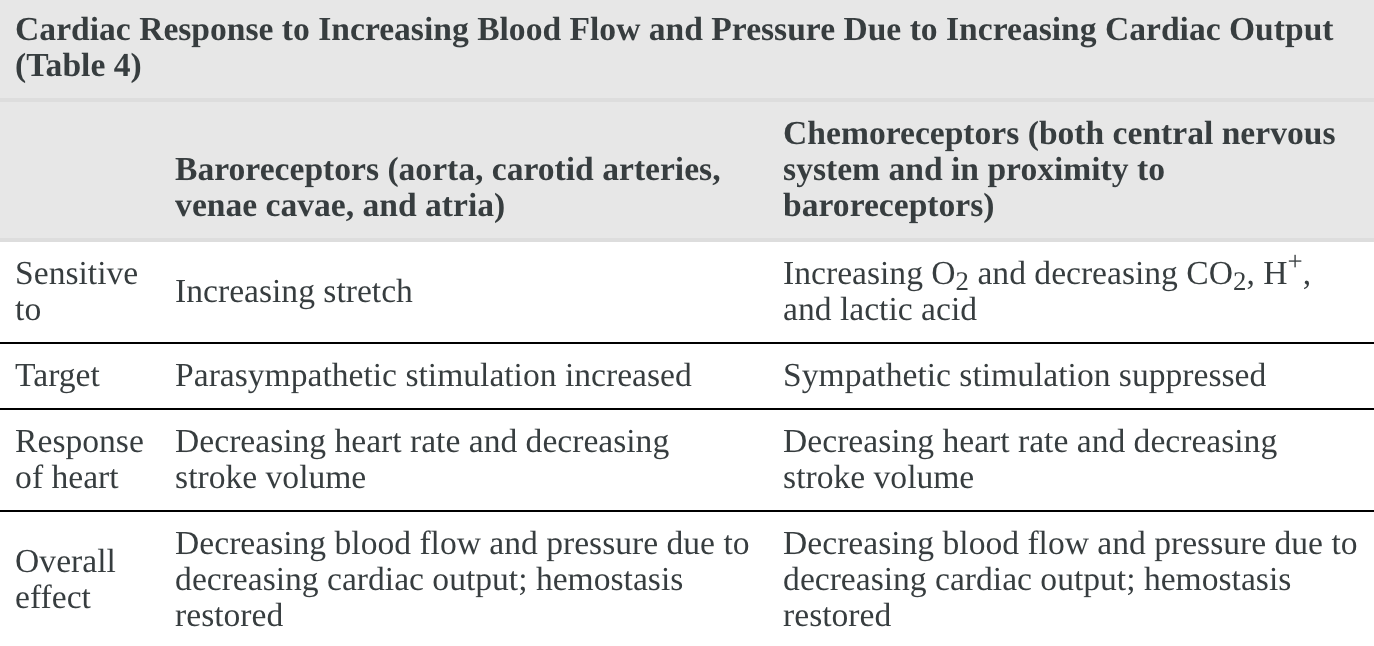
Cardiovascular Response to Increased Blood Pressure
The following chart describes the cardiovascular response to an increase in blood pressure. Notice how the receptors both cause an overall decrease in HR and SV despite responding to different indicators and targeting different regions of the autonomic nervous system? Due to the relationship between these variables and MAP, decreased HR and SV will result in a decrease in MAP in an attempt to restore normal levels.
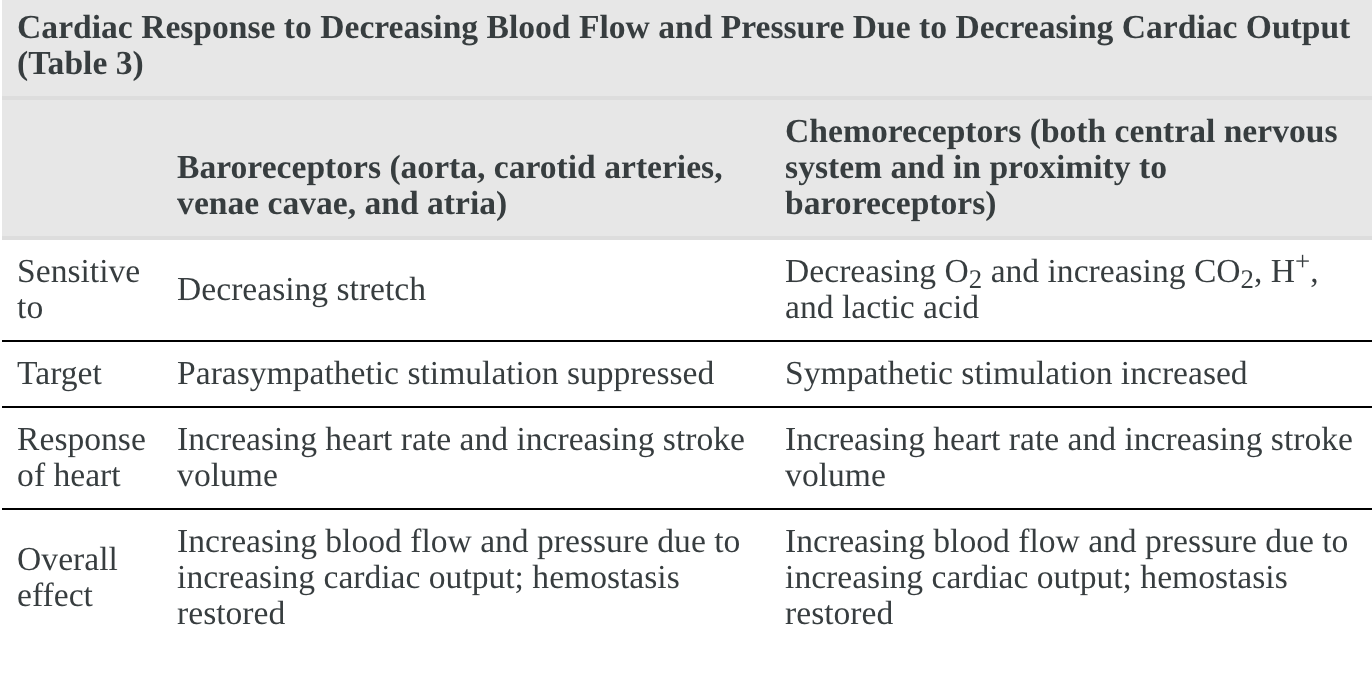
Cardiovascular Response to Decreased Blood Pressure
Note that this table is the exact opposite of the last one and describes the cardiovascular response to a decrease in blood pressure. In this case, the receptors work to increase HR and SV, and therefore increase MAP to promote restoration of normal ranges.
Test Your Knowledge
Clinical Application:
Aging has been associated with reduced sensitivity in high-pressure baroreceptors. Older individuals with this decreased sensor sensitivity often also present with high blood pressure levels. Explain why this association makes sense. Hint: Recall the baroreceptors’ significance to MAP regulation.
Blood Pressure Regulation Cascade
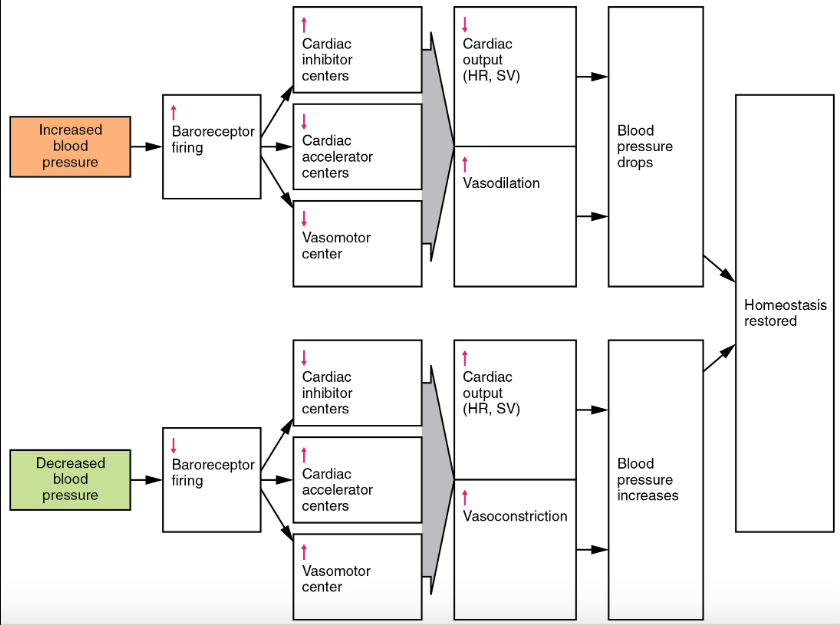
So far, we have discussed each of the boxes included in the blood pressure regulation cascade in detail. Go through and see if you can still define each “step” and try and understand what makes it relevant to the regulation of blood pressure…
Test Your Knowledge
Thinking Beyond:
The sensor-effector-coordinating center triad has been discussed in previous units, such as the central nervous system. Apply your newfound knowledge of MAP regulation and your previous knowledge of the triad to the following two scenarios.
- Running late for an exam causing a sudden spike in MAP.
- Experiencing severe dehydration causing a decrease in MAP. Hint: When tackling these problems, try to start with identifying the sensors that will detect fluctuations in the variable. Knowing the sensors involved will help you remember what information is sent to the coordinating center and the cascade promoted at the effectors.
Key Takeaways
Consider the following concepts to help guide your studies:
- MAP explains the average arterial pressure in one cardiac cycle.
- MAP is calculated through CO and TPR by the following equation: [latex]MAP = CO * TPR[/latex]
- MAP is a regulated variable. The body will initiate a cardiac response to fluctuations in an attempt to maintain homeostasis.
- The high-pressure baroreceptors are located in the Carotid Sinus and Aortic Arch, where they monitor MAP fluctuations. When levels deviate out of the homeostatic range, these baroreceptors will alter action potential firing patterns that signal central control, and the necessary cascades are initiated.
- Various factors can cause increases or decreases in MAP.
Subchapter Quiz
The questions below can be used to assess your knowledge within this chapter. There are five multiple-choice questions that you should attempt without referring to your notes. The questions will provide you with responses to your answers to guide your studying but should not be used as your only resource.
Media Attributions
- Baroreflex Activation © Darrel Francis is licensed under a CC BY-SA (Attribution ShareAlike) license
- Cardiac Response to Increasing Blood Flow and Pressure Due to Increased Cardiac Output © Rice University is licensed under a CC BY (Attribution) license
- Response to Decreasing Cardiac Output © Rice University is licensed under a CC BY (Attribution) license
- Baroreceptor Response © Rice University is licensed under a CC BY (Attribution) license
- DeMers, D., & Wachs, D. (2020). Physiology, Mean Arterial Pressure. In StatPearls. StatPearls Publishing. ↵
Everything that takes place between one heart beat and the next.
A state of relatively stable equilibrium in the body that is maintained by constant adjustment of biochemical and physiological pathways.
The amount of blood pumped through the circulatory system in 1 minute (L/min).
Volume of blood ejected from the heart each cardiac cycle (mL).
Relaxation of smooth muscle cells and the widening of blood vessels. This will allow for more blood flow through the vasculature.
Contraction of smooth muscle cells and the tightening of blood vessels. This will allow for less blood flow through the vasculature.
